 9
9peptides
spectra
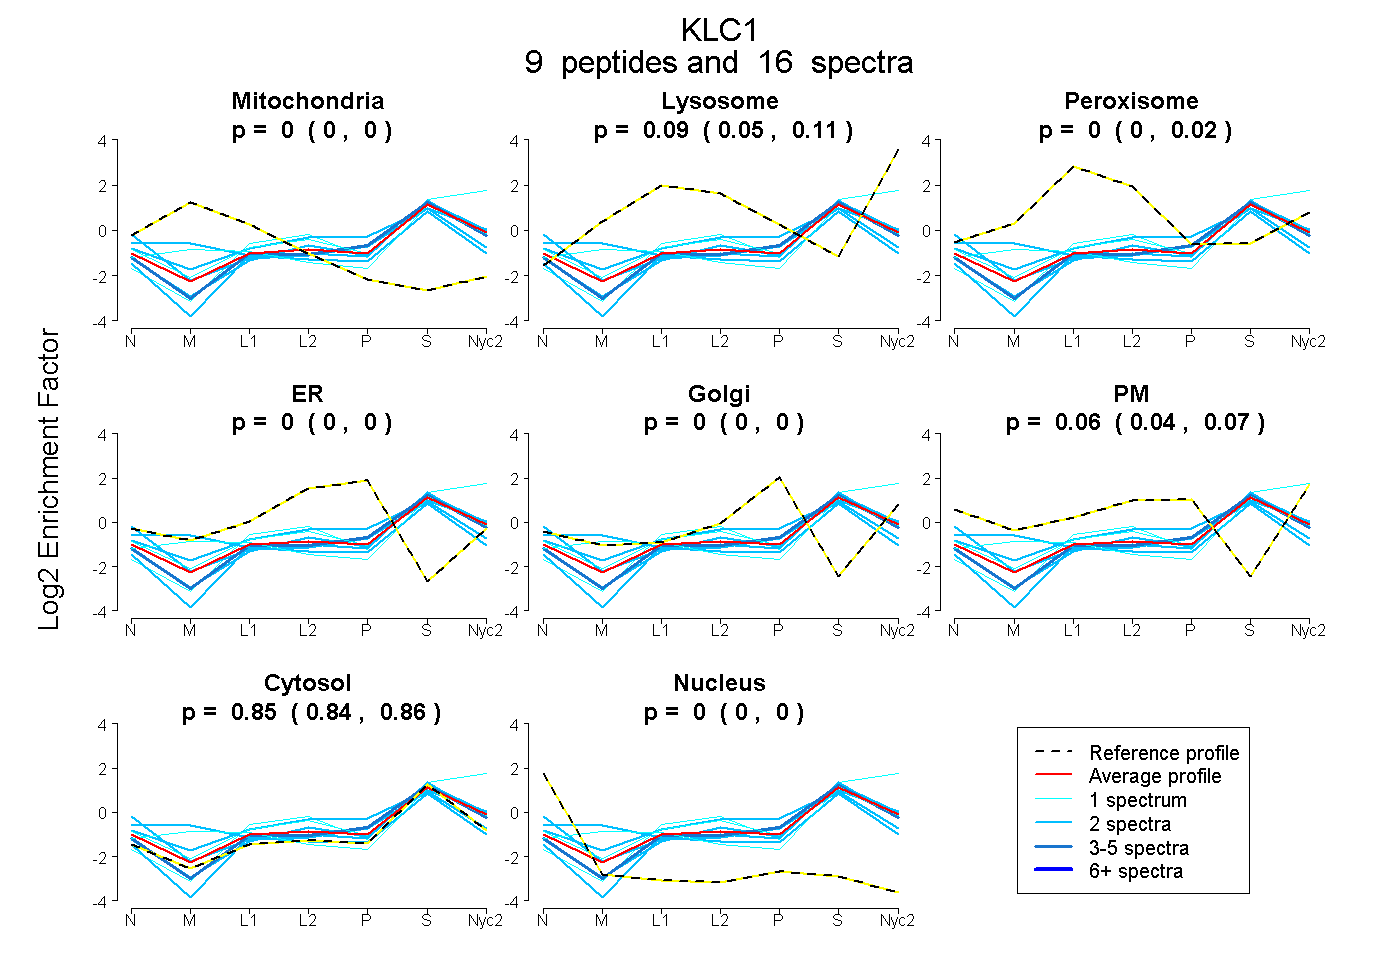
0.000 | 0.000
0.052 | 0.106
0.000 | 0.025
0.000 | 0.000
0.000 | 0.000
0.039 | 0.074
0.836 | 0.861
0.000 | 0.000
1peptide
spectrum
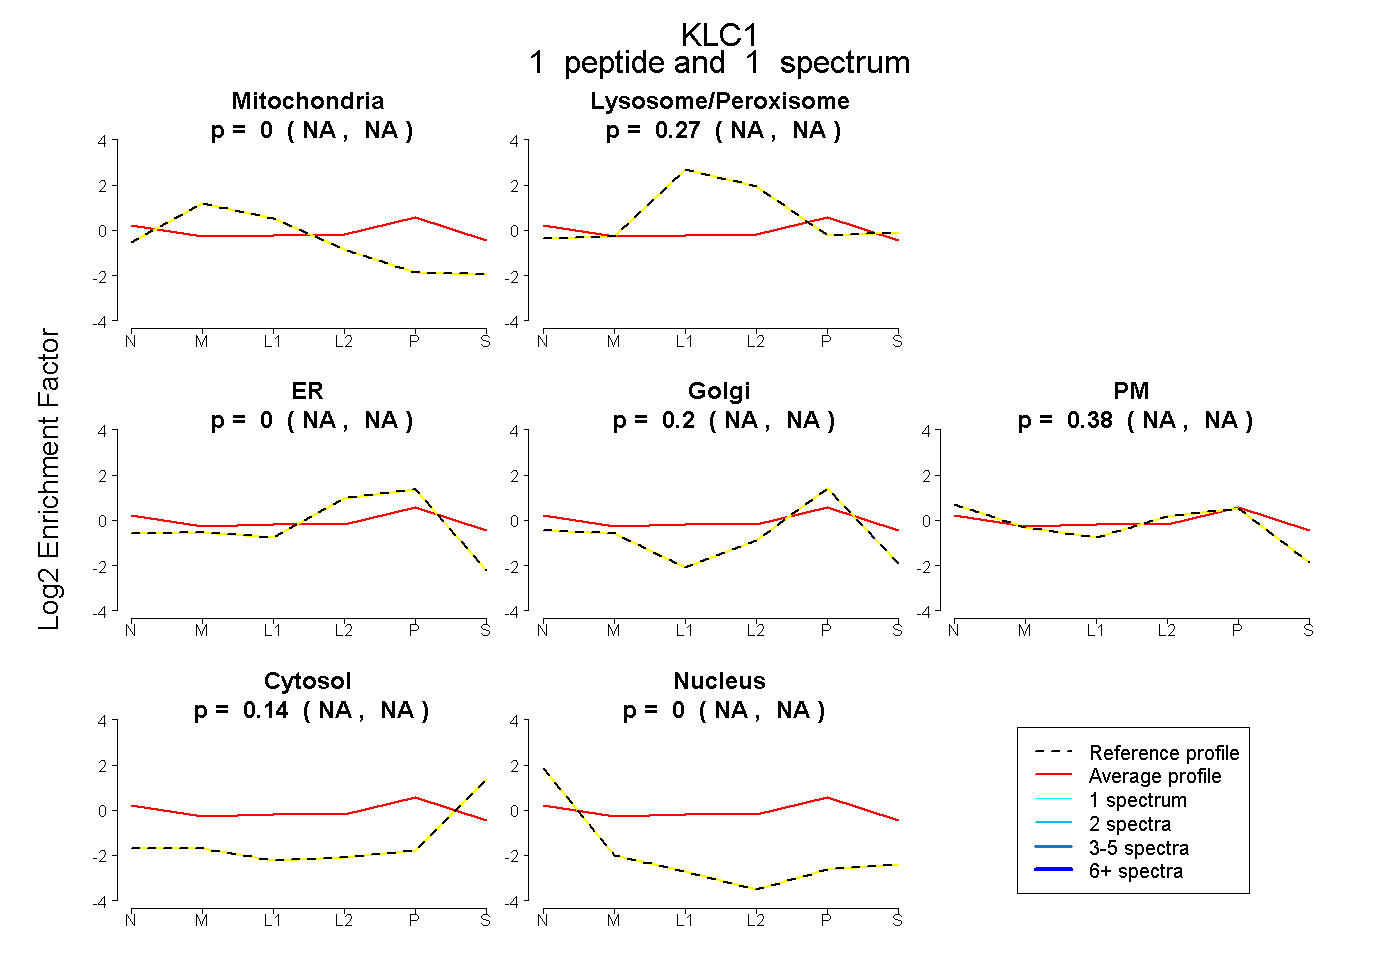
NA | NA
NA | NA
NA | NA
NA | NA
NA | NA
NA | NA
NA | NA
4peptides
spectra
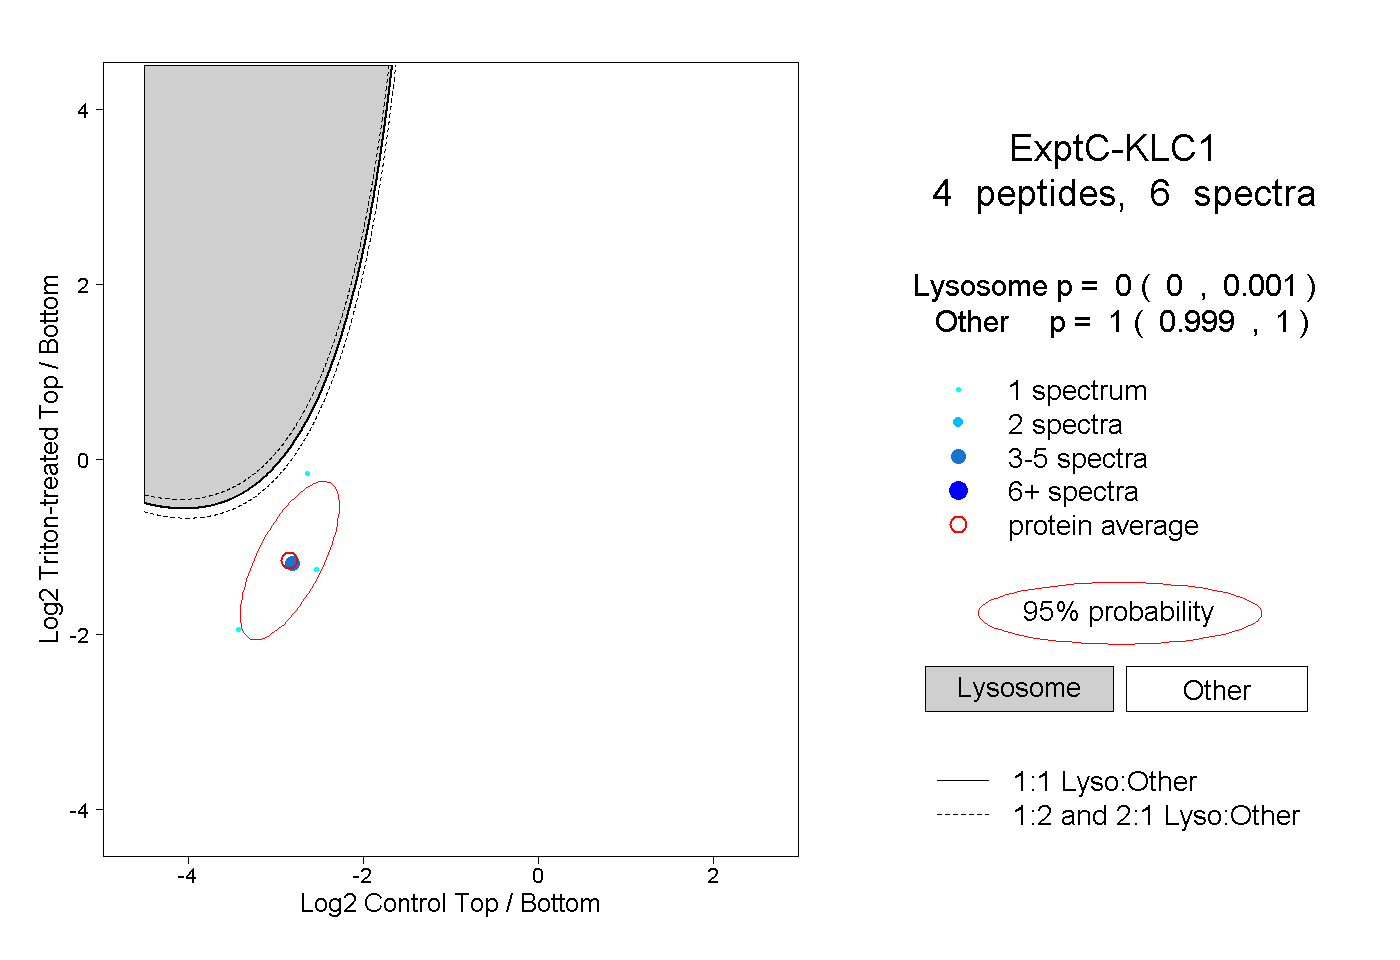
0.000 | 0.001
0.999 | 1.000
1peptide
spectrum
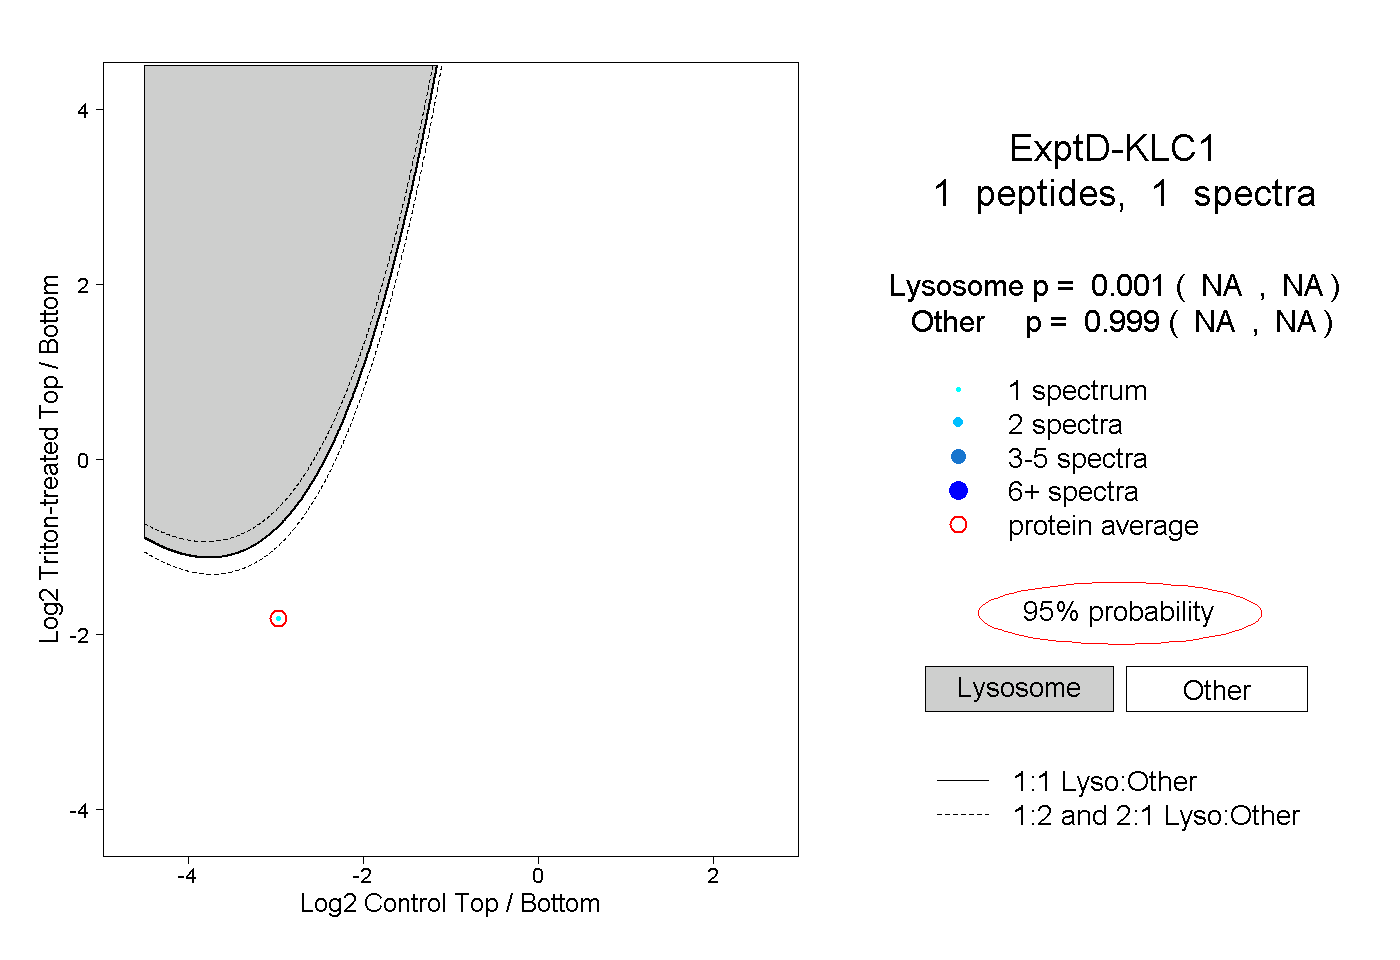
NA | NA
NA | NA