 19
19peptides
spectra

0.000 | 0.000
0.790 | 0.795
0.000 | 0.000
0.000 | 0.000
0.000 | 0.000
0.000 | 0.000
0.204 | 0.209
0.000 | 0.000
10peptides
spectra
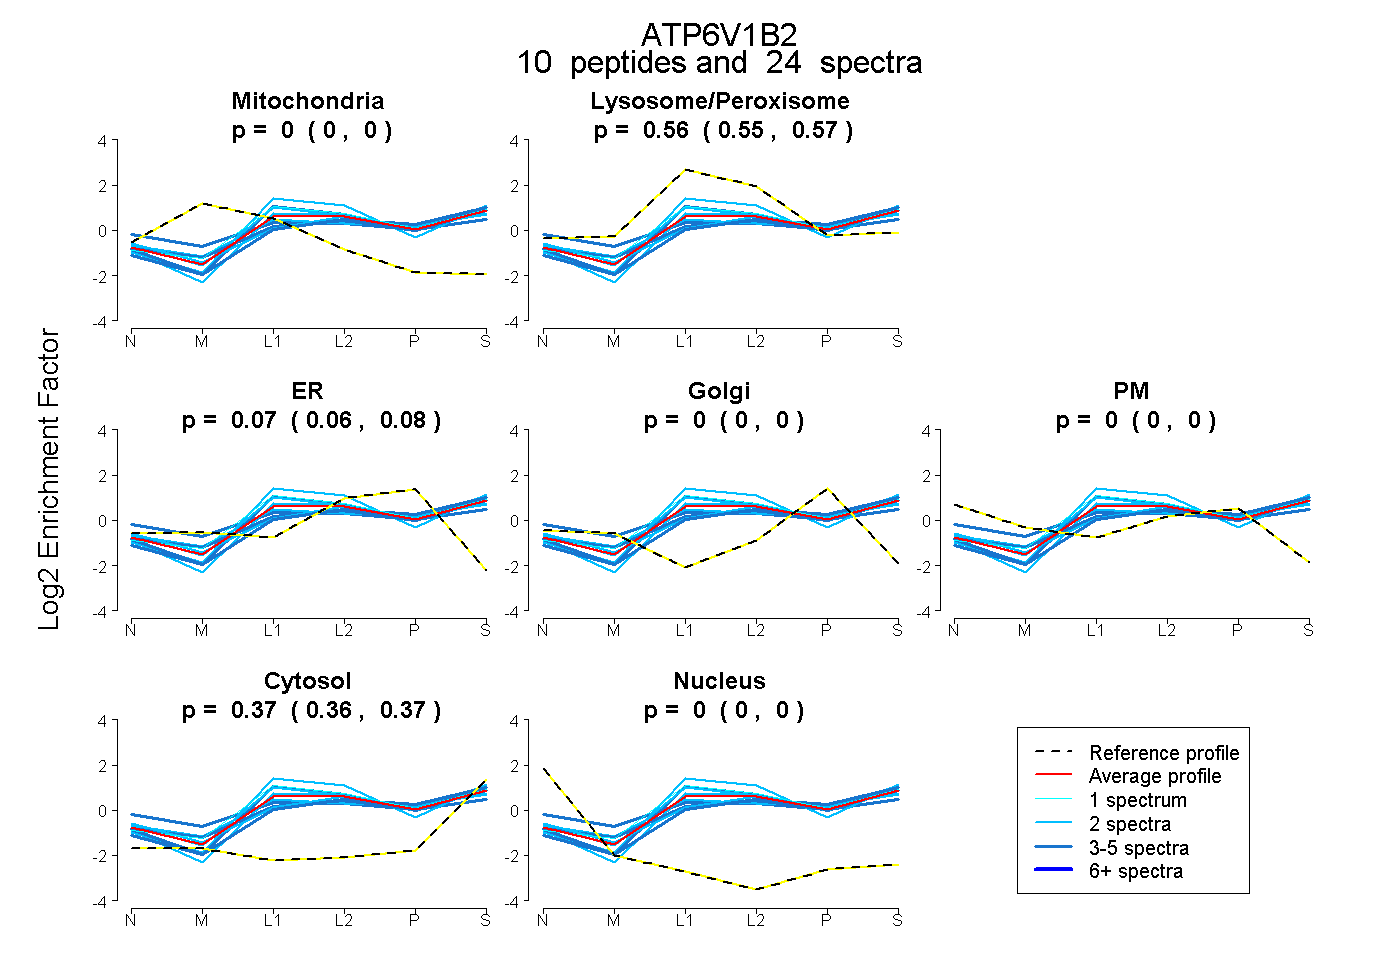
0.000 | 0.000
0.551 | 0.573
0.060 | 0.078
0.000 | 0.000
0.000 | 0.000
0.361 | 0.372
0.000 | 0.000
21peptides
spectra
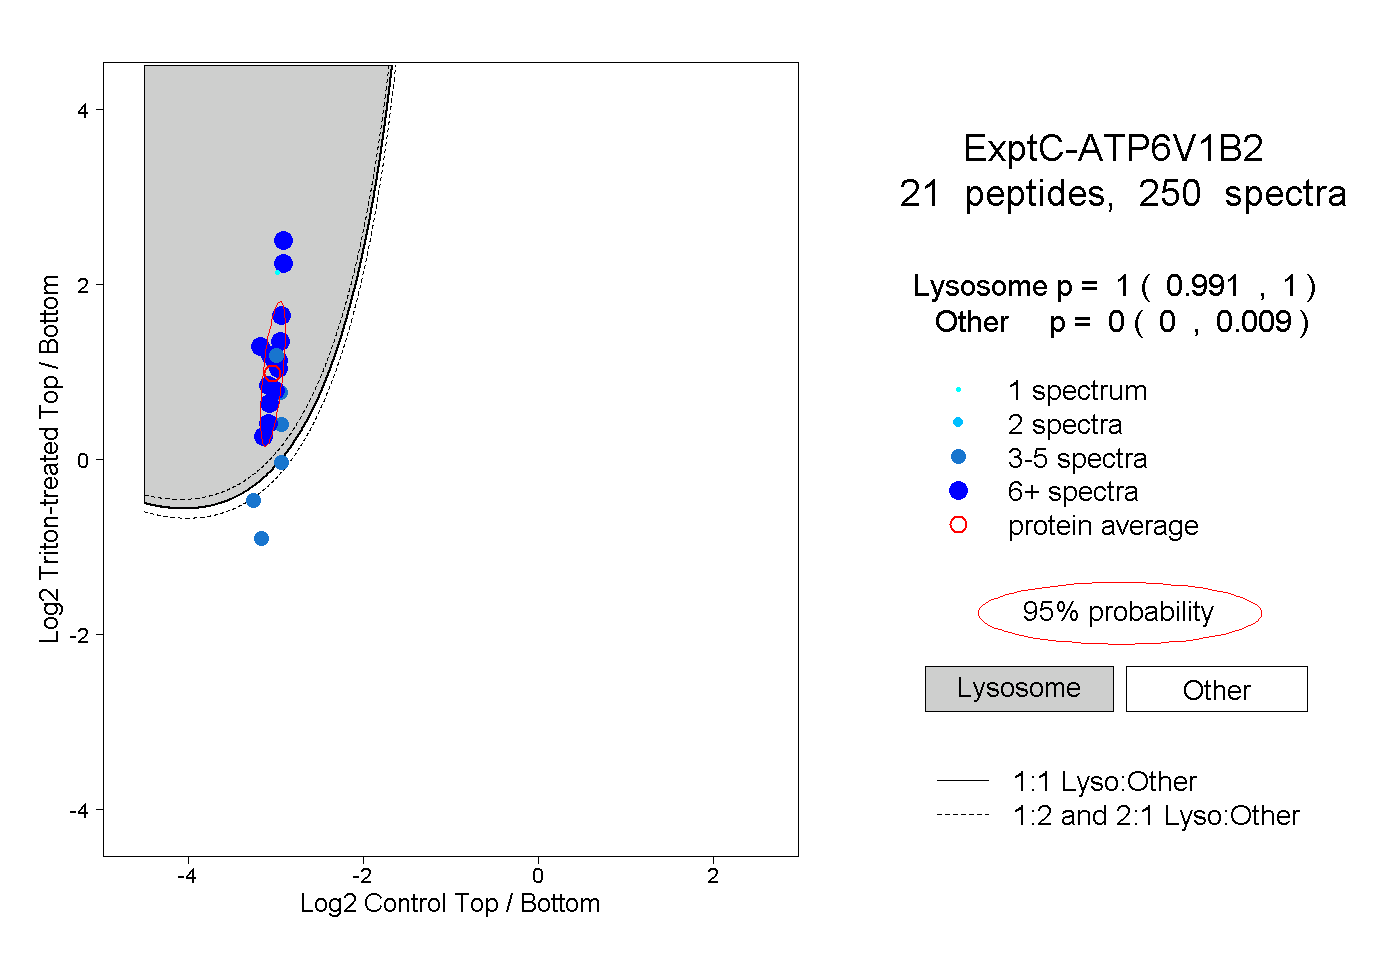
0.991 | 1.000
0.000 | 0.009
6peptides
spectra
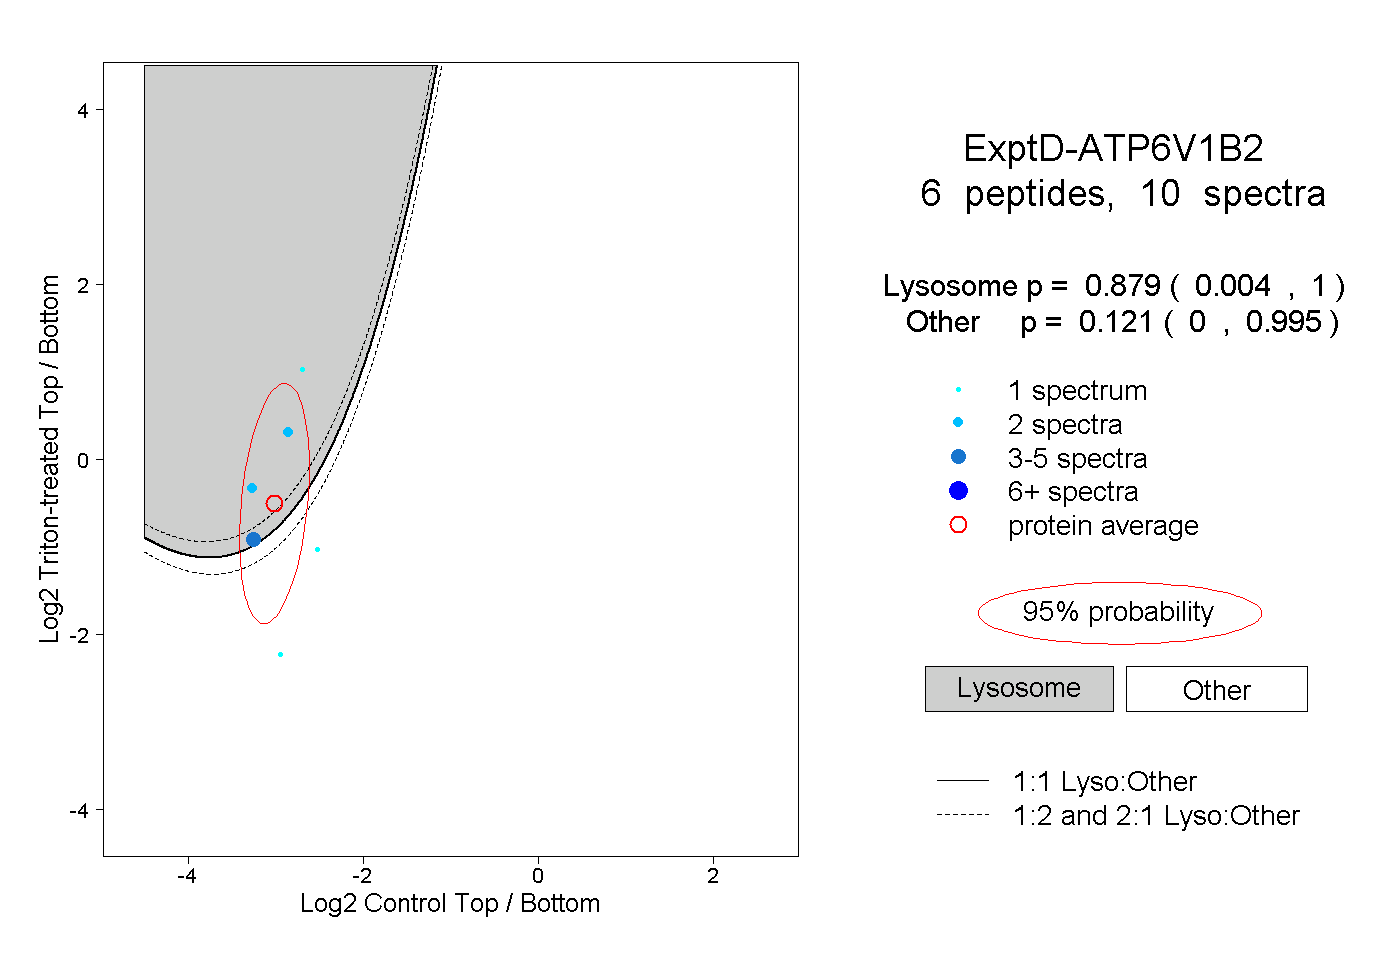
0.004 | 1.000
0.000 | 0.995