 4
4peptides
spectra
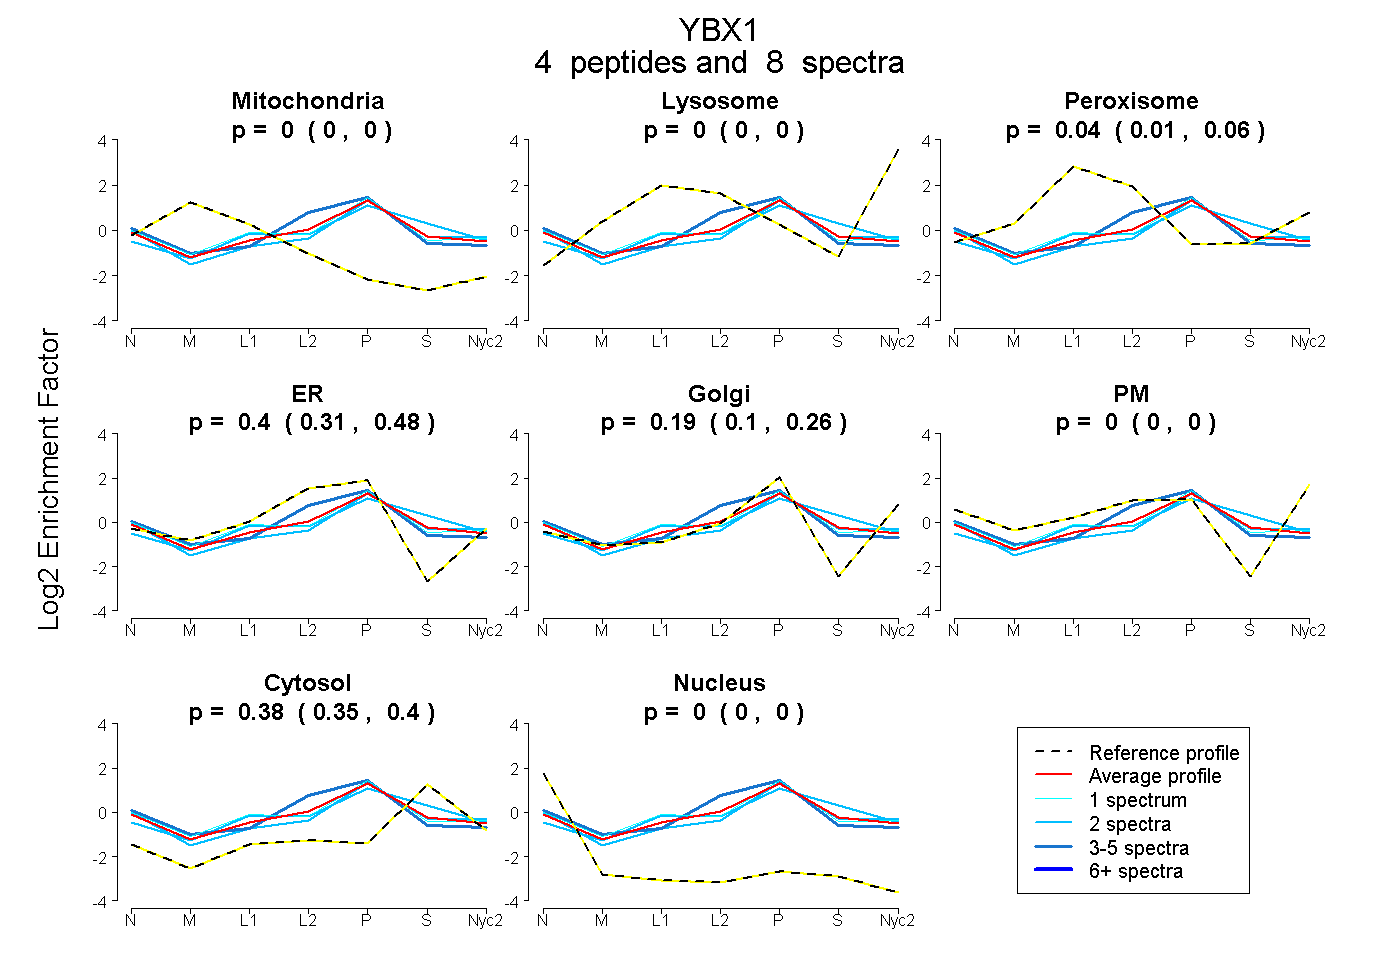
0.000 | 0.000
0.000 | 0.000
0.005 | 0.064
0.305 | 0.482
0.096 | 0.263
0.000 | 0.000
0.349 | 0.397
0.000 | 0.000
2peptides
spectra
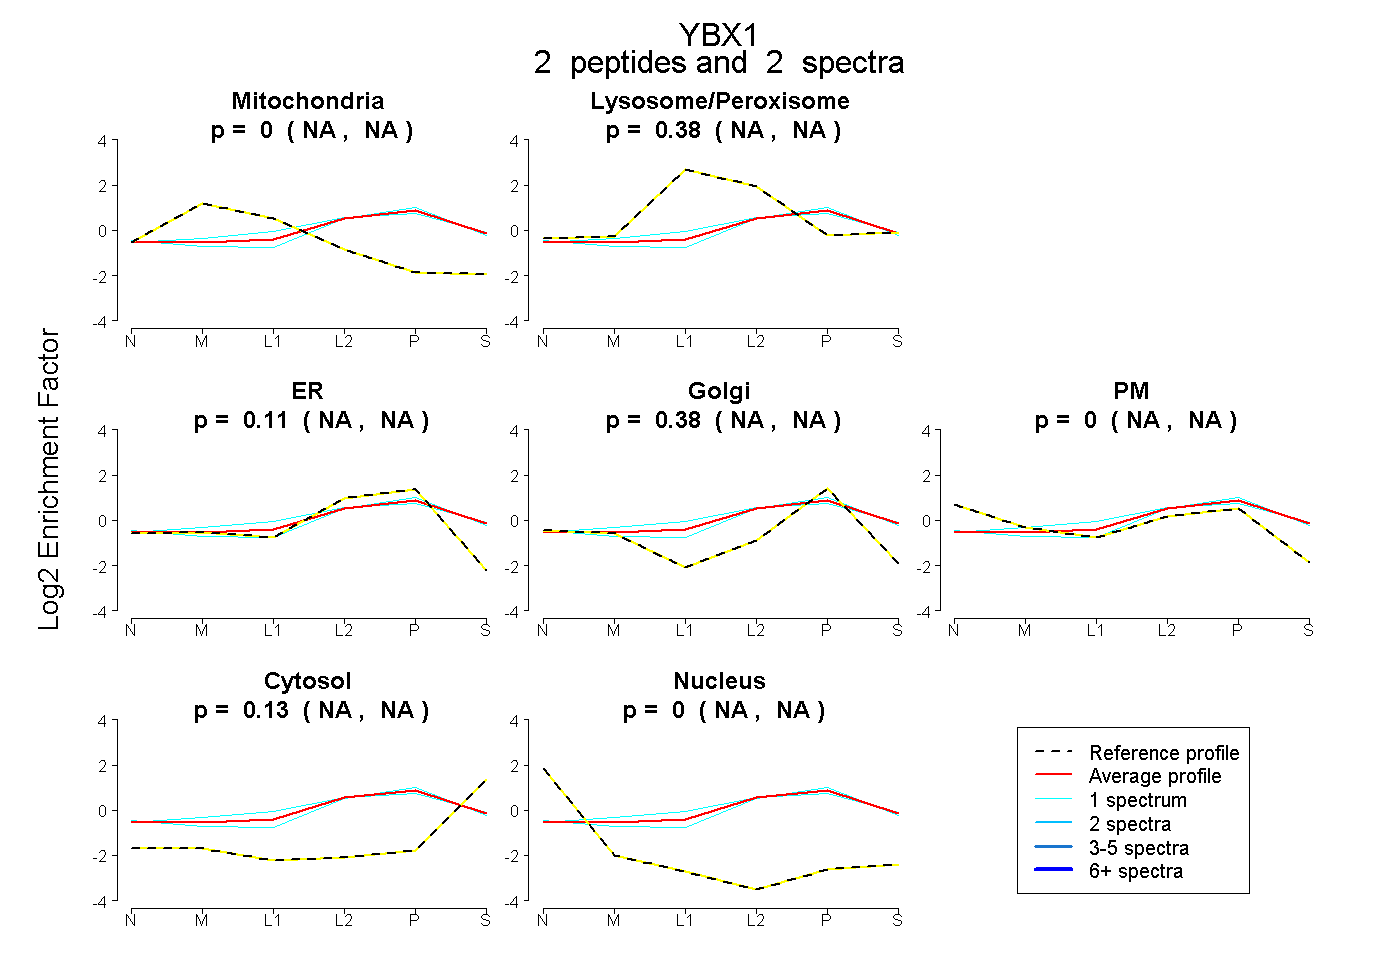
NA | NA
NA | NA
NA | NA
NA | NA
NA | NA
NA | NA
NA | NA
3peptides
spectra
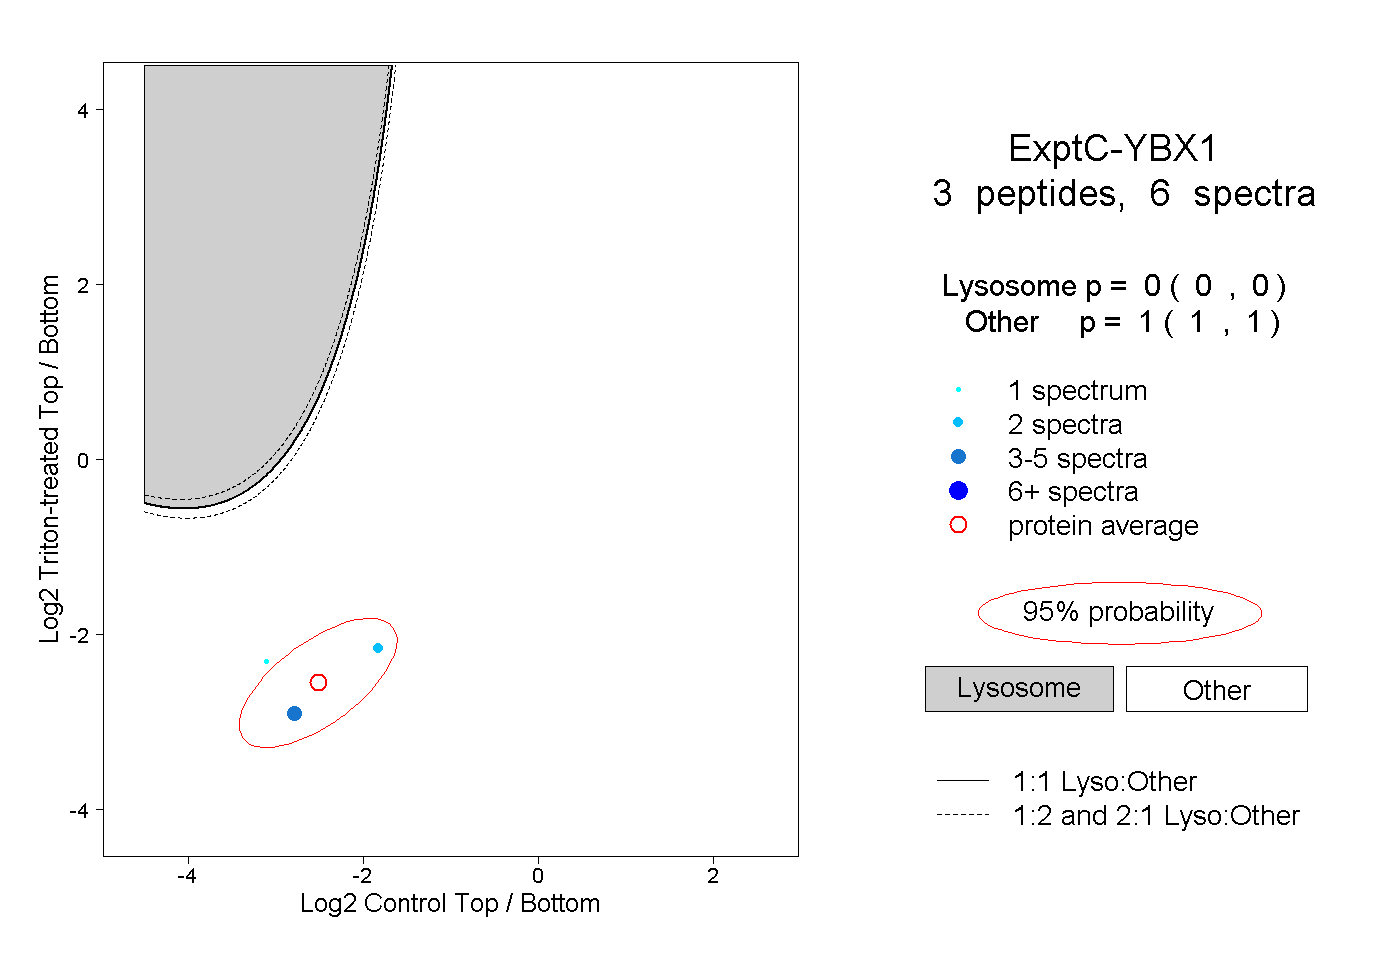
0.000 | 0.000
1.000 | 1.000