11
11peptides
spectra
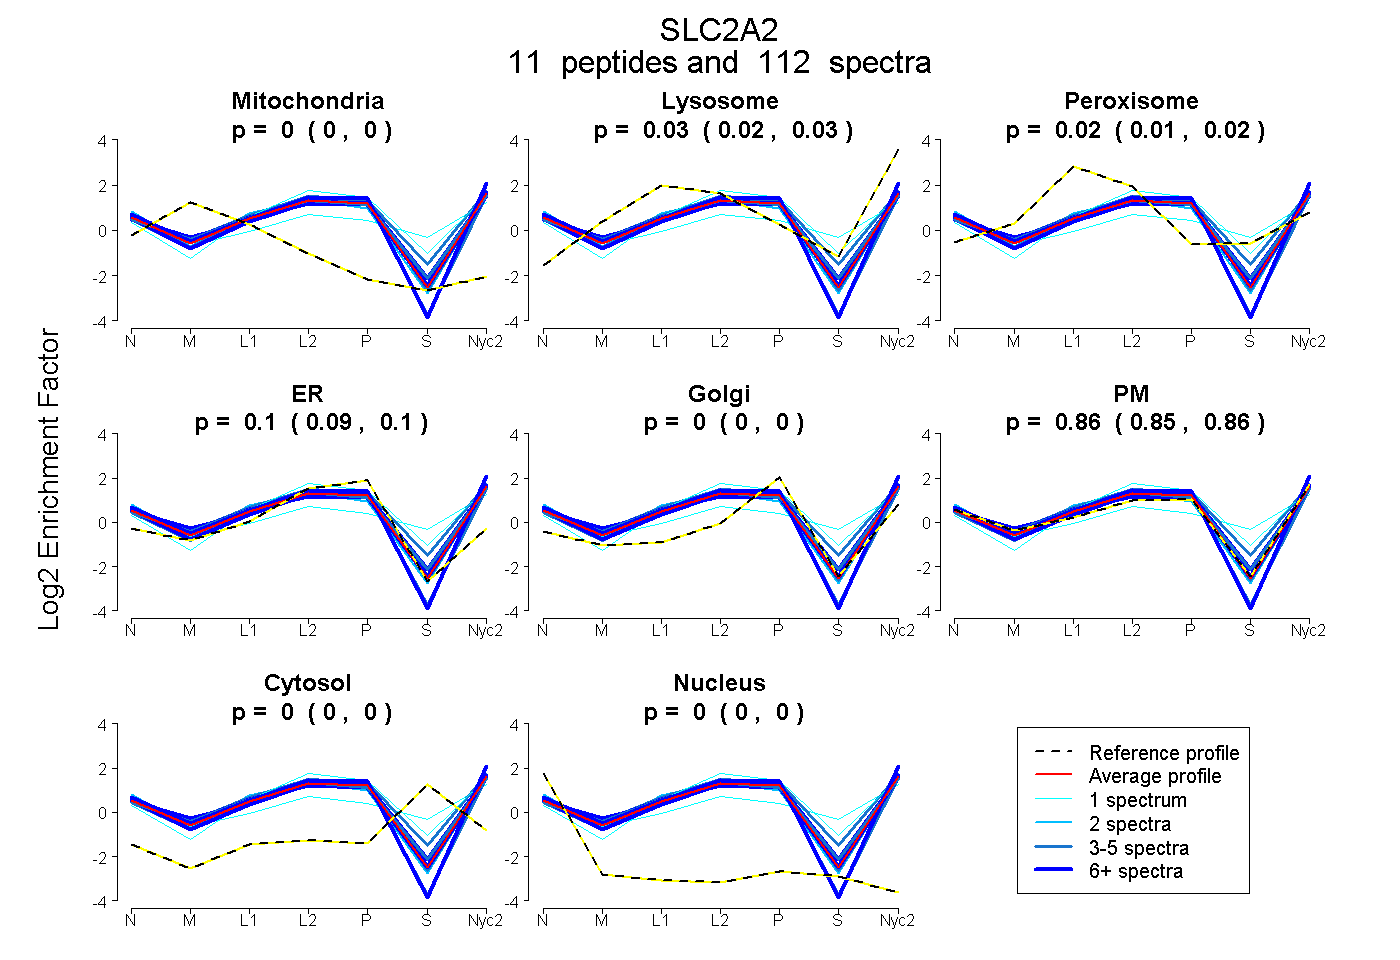
0.000 | 0.000
0.025 | 0.031
0.013 | 0.023
0.091 | 0.099
0.000 | 0.000
0.853 | 0.862
0.000 | 0.000
0.000 | 0.000
7peptides
spectra
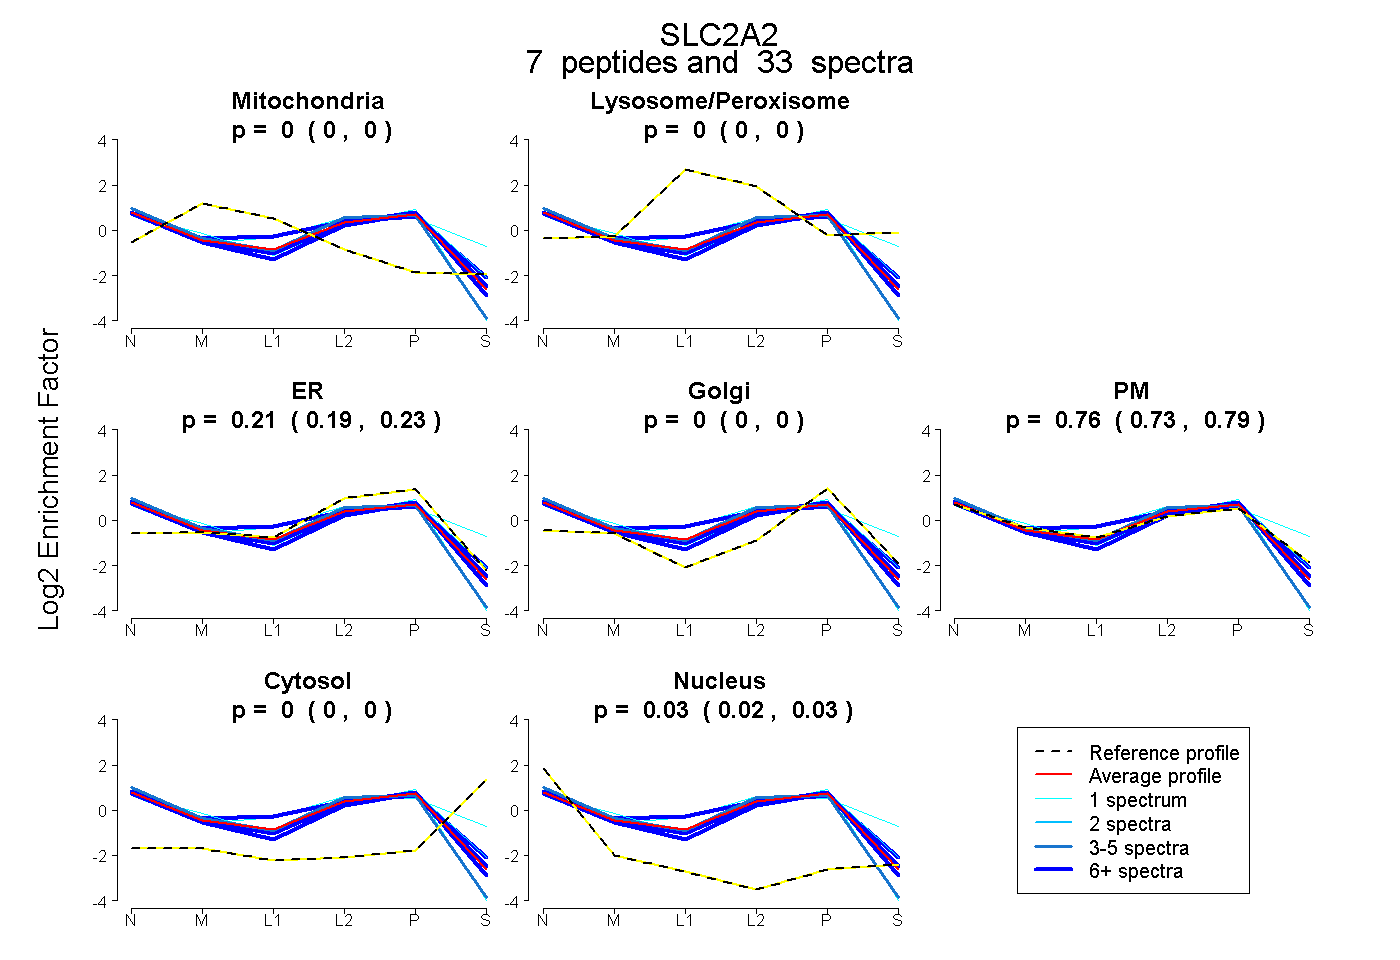
0.000 | 0.000
0.000 | 0.000
0.186 | 0.233
0.000 | 0.000
0.727 | 0.791
0.000 | 0.000
0.017 | 0.033
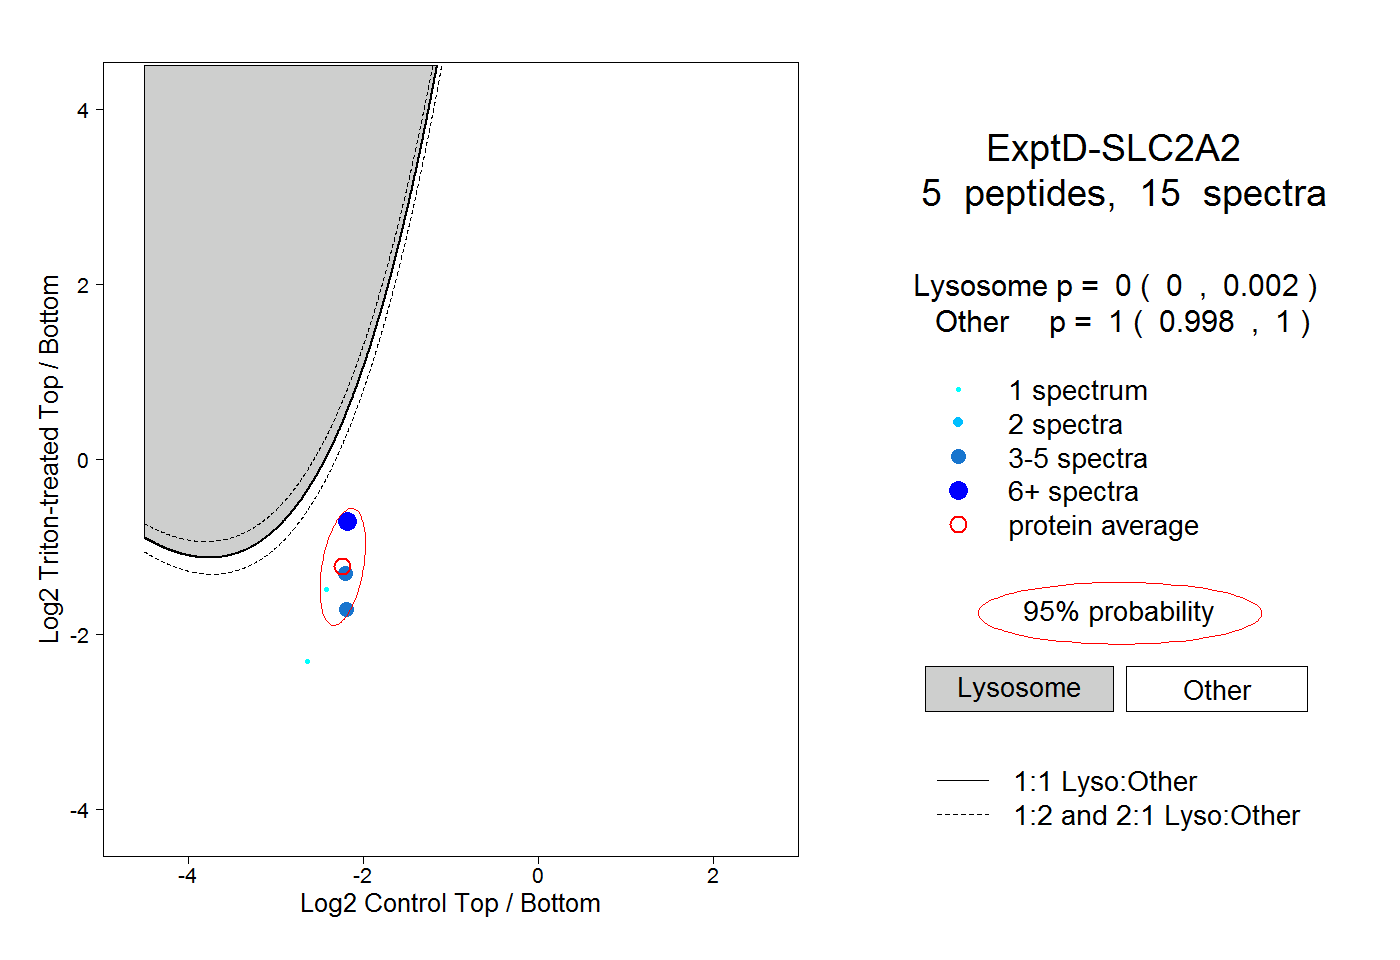
8peptides
spectra
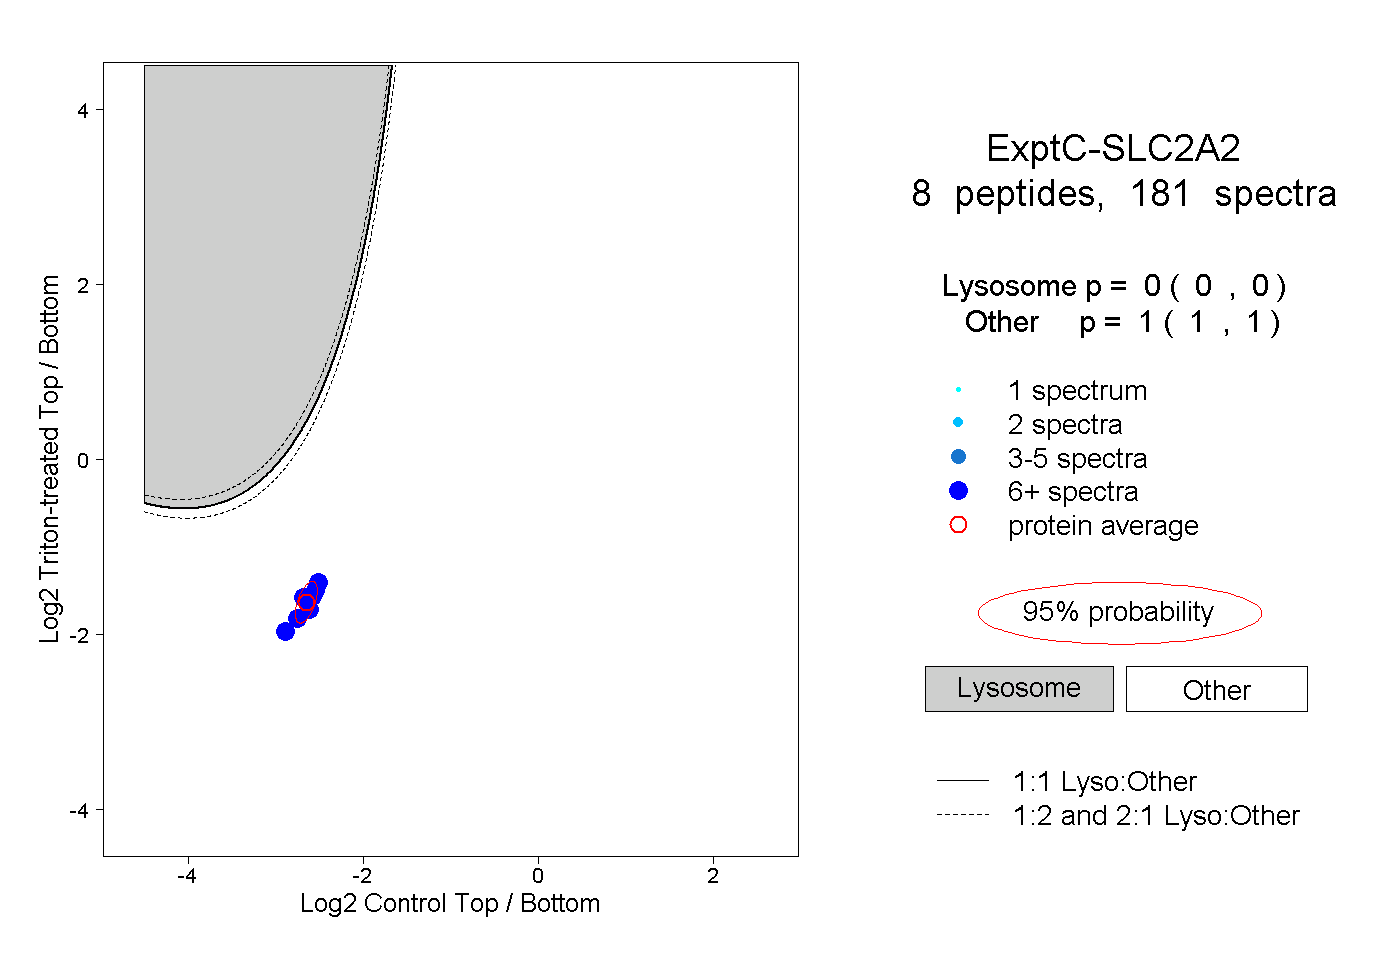
0.000 | 0.000
1.000 | 1.000