SLC2A2
[ENSRNOP00000015866]
Main page
| | | Plot |
Mito |
Lyso |
|
Perox |
ER |
Golgi |
PM |
Cytosol |
Nucleus |
|
| Expt A |
 11
11
peptides |
112
spectra |
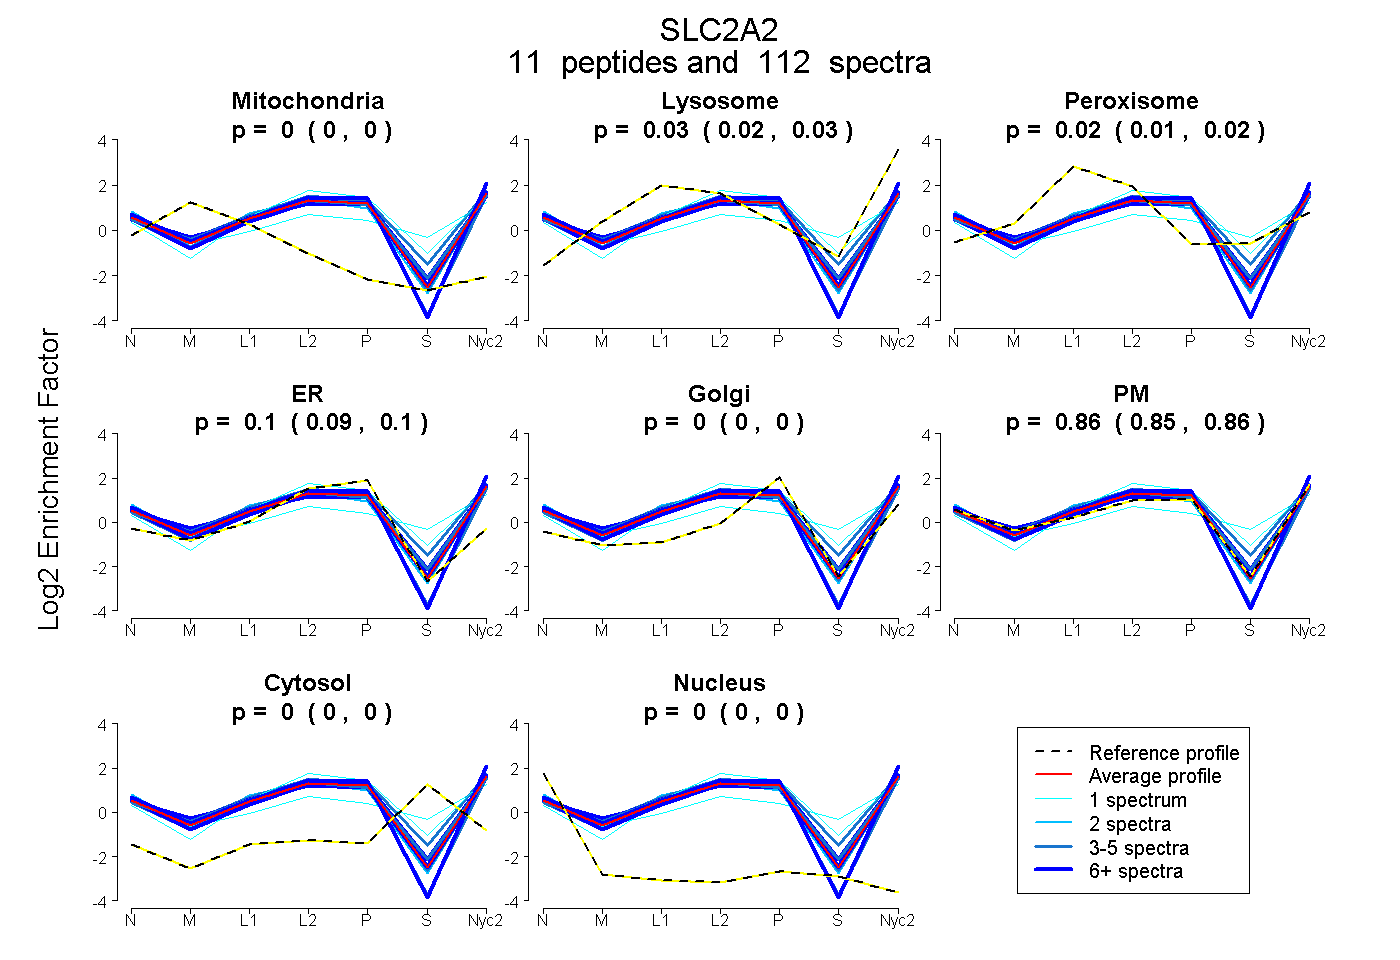 |
0.000
0.000 | 0.000 |
0.028
0.025 | 0.031 |
|
0.018
0.013 | 0.023 |
0.096
0.091 | 0.099 |
0.000
0.000 | 0.000 |
0.858
0.853 | 0.862 |
0.000
0.000 | 0.000 |
0.000
0.000 | 0.000 |
|
| | | Plot |
Mito |
|
Lyso or Perox |
|
ER |
Golgi |
PM |
Cytosol |
Nucleus |
|
| Expt B |
7
peptides |
33
spectra |
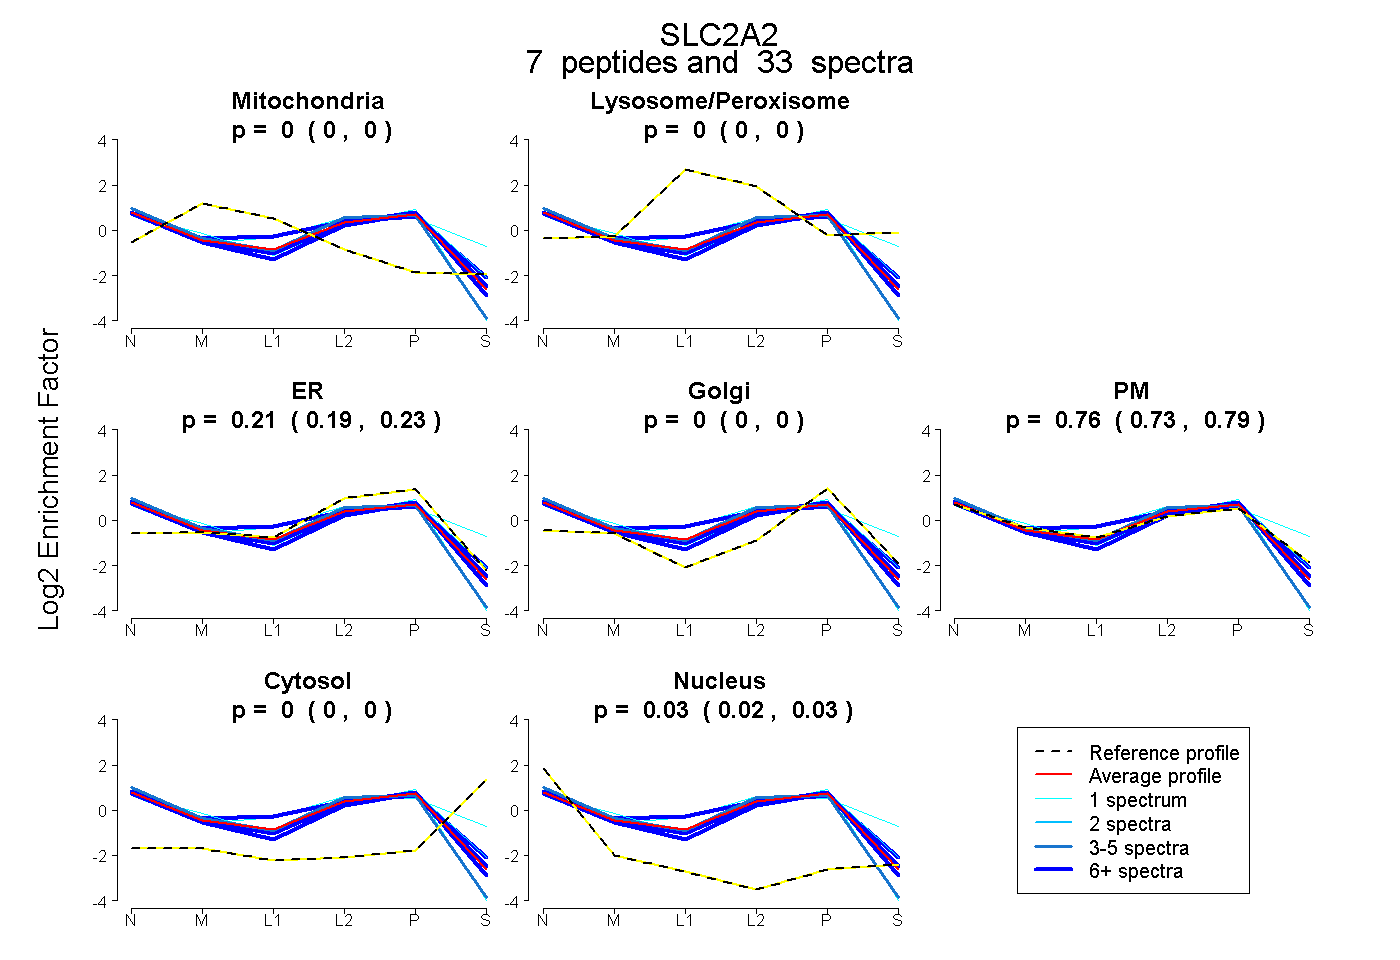 |
0.000
0.000 | 0.000 |
|
0.000
0.000 | 0.000 |
|
0.212
0.186 | 0.233 |
0.000
0.000 | 0.000 |
0.763
0.727 | 0.791 |
0.000
0.000 | 0.000 |
0.026
0.017 | 0.033 |
|
| 3 spectra, VSVIQLFTDPNYR |
0.000 |
|
0.000 |
|
0.379 |
0.000 |
0.548 |
0.000 |
0.073 |
|
| 7 spectra, SFDEIAAEFR |
0.000 |
|
0.000 |
|
0.274 |
0.048 |
0.600 |
0.000 |
0.078 |
|
| 10 spectra, FGPAHALIIAGR |
0.000 |
|
0.078 |
|
0.067 |
0.000 |
0.854 |
0.000 |
0.000 |
|
| 1 spectrum, HVLGVPLDDR |
0.000 |
|
0.000 |
|
0.597 |
0.000 |
0.284 |
0.000 |
0.119 |
|
| 10 spectra, LEEEVR |
0.000 |
|
0.000 |
|
0.313 |
0.000 |
0.626 |
0.000 |
0.060 |
|
| 1 spectrum, GTEDVTK |
0.000 |
|
0.000 |
|
0.083 |
0.080 |
0.827 |
0.000 |
0.010 |
|
| 1 spectrum, EEASTEQK |
0.000 |
|
0.222 |
|
0.000 |
0.000 |
0.696 |
0.082 |
0.000 |
|
| | | Plot |
|
Lyso |
|
|
|
|
|
|
|
Other |
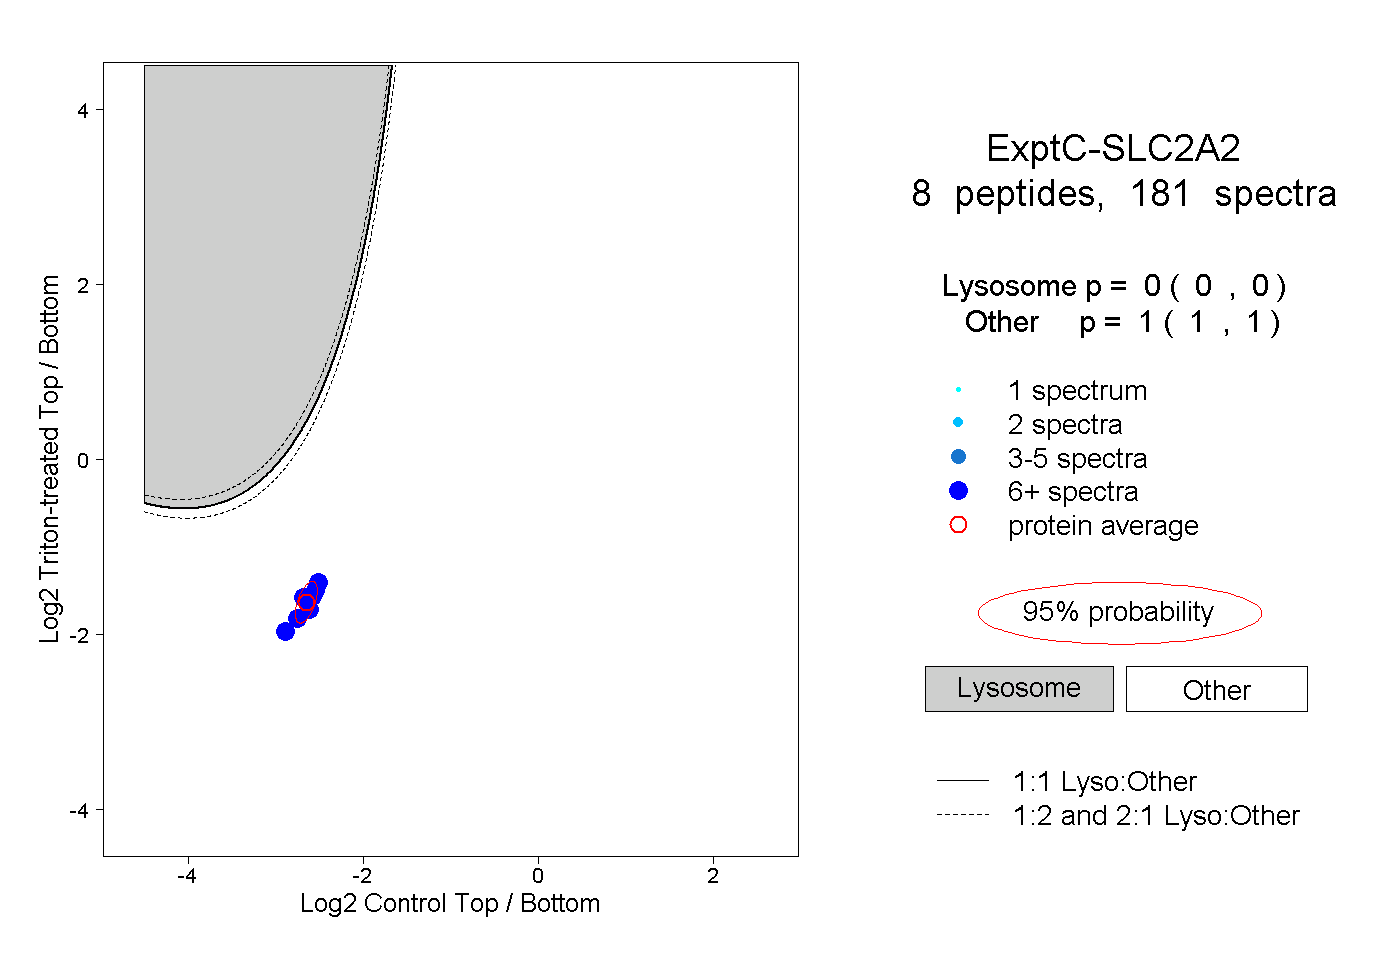
| Expt C |
8
peptides |
181
spectra |
 |
|
0.000
0.000 | 0.000 |
|
|
|
|
|
|
|
1.000
1.000 | 1.000 |
| | | Plot |
|
Lyso |
|
|
|
|
|
|
|
Other |
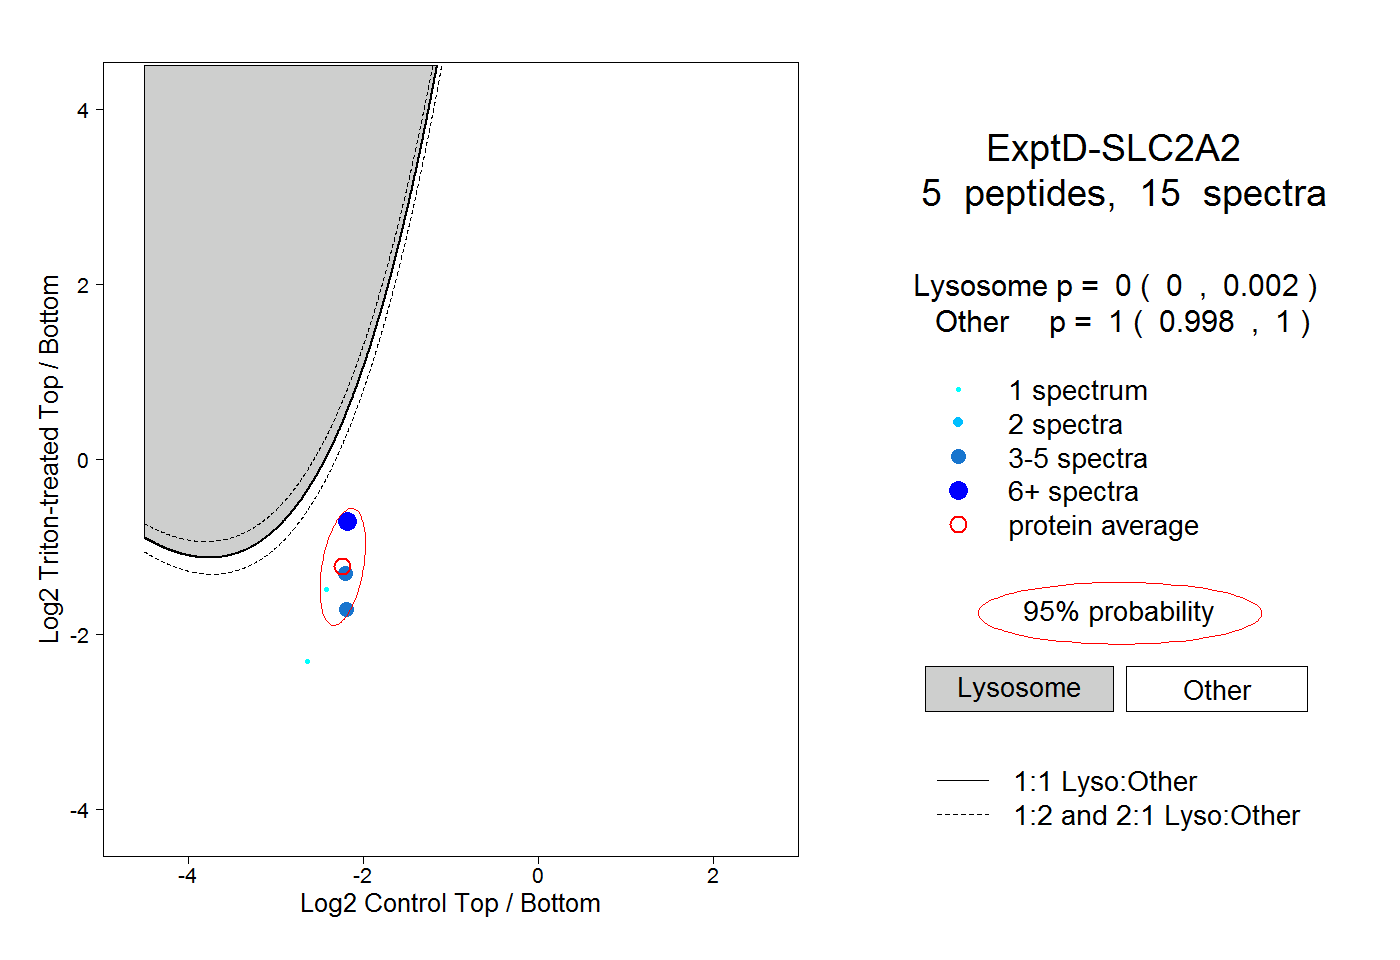
| Expt D |
5
peptides |
15
spectra |
 |
|
0.000
0.000 | 0.002 |
|
|
|
|
|
|
|
1.000
0.998 | 1.000 |