 11
11peptides
spectra
0.000 | 0.000
0.025 | 0.031
0.013 | 0.023
0.091 | 0.099
0.000 | 0.000
0.853 | 0.862
0.000 | 0.000
0.000 | 0.000
| Plot | Mito | Lyso | Perox | ER | Golgi | PM | Cytosol | Nucleus | |||||
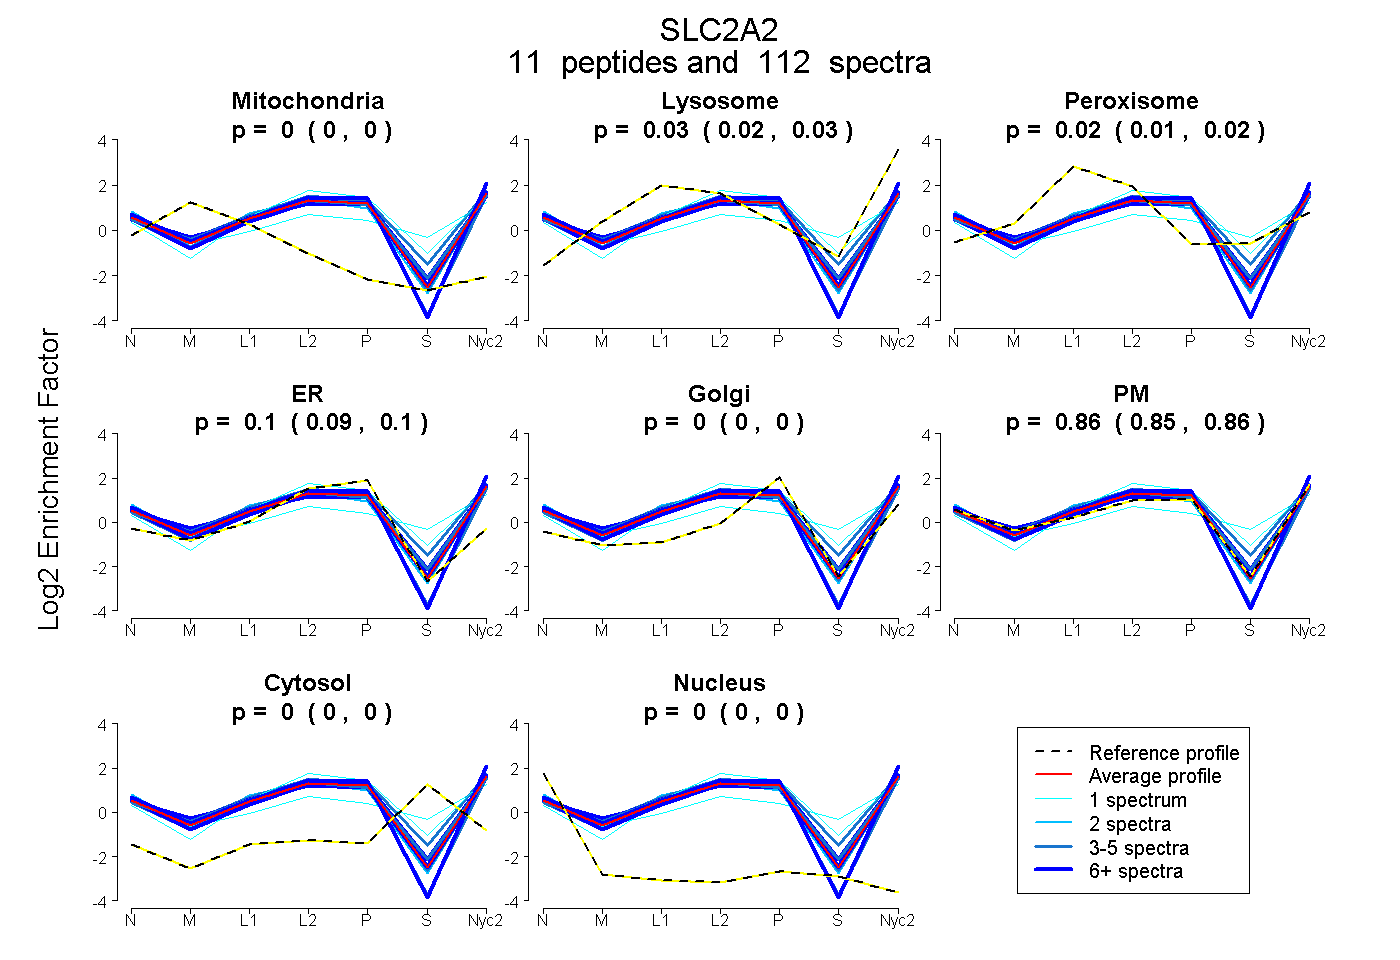
| Expt A |
11 peptides |
112 spectra |
|
0.000 0.000 | 0.000 |
0.028 0.025 | 0.031 |
0.018 0.013 | 0.023 |
0.096 0.091 | 0.099 |
0.000 0.000 | 0.000 |
0.858 0.853 | 0.862 |
0.000 0.000 | 0.000 |
0.000 0.000 | 0.000 |
| 10 spectra, VSVIQLFTDPNYR | 0.000 | 0.000 | 0.000 | 0.011 | 0.000 | 0.989 | 0.000 | 0.000 | ||
| 32 spectra, SFDEIAAEFR | 0.000 | 0.000 | 0.061 | 0.065 | 0.000 | 0.874 | 0.000 | 0.000 | ||
| 28 spectra, FGPAHALIIAGR | 0.000 | 0.051 | 0.018 | 0.076 | 0.000 | 0.855 | 0.000 | 0.000 | ||
| 3 spectra, SGSAPPR | 0.000 | 0.033 | 0.097 | 0.100 | 0.000 | 0.771 | 0.000 | 0.000 | ||
| 3 spectra, GTEDVTK | 0.000 | 0.000 | 0.000 | 0.170 | 0.000 | 0.830 | 0.000 | 0.000 | ||
| 3 spectra, EEASTEQK | 0.000 | 0.022 | 0.000 | 0.161 | 0.000 | 0.817 | 0.000 | 0.000 | ||
| 3 spectra, DINEMR | 0.000 | 0.105 | 0.067 | 0.082 | 0.000 | 0.706 | 0.040 | 0.000 | ||
| 1 spectrum, HVLGVPLDDR | 0.000 | 0.153 | 0.075 | 0.254 | 0.000 | 0.444 | 0.074 | 0.000 | ||
| 1 spectrum, AAVQMEFLGSSETV | 0.000 | 0.023 | 0.133 | 0.000 | 0.000 | 0.577 | 0.267 | 0.000 | ||
| 2 spectra, AMLAANSLSLTGALLMGCSK | 0.000 | 0.000 | 0.056 | 0.038 | 0.000 | 0.906 | 0.000 | 0.000 | ||
| 26 spectra, LEEEVR | 0.000 | 0.017 | 0.038 | 0.109 | 0.000 | 0.824 | 0.013 | 0.000 |
| Plot | Mito | Lyso or Perox | ER | Golgi | PM | Cytosol | Nucleus | ||||||
| Expt B |
7 peptides |
33 spectra |
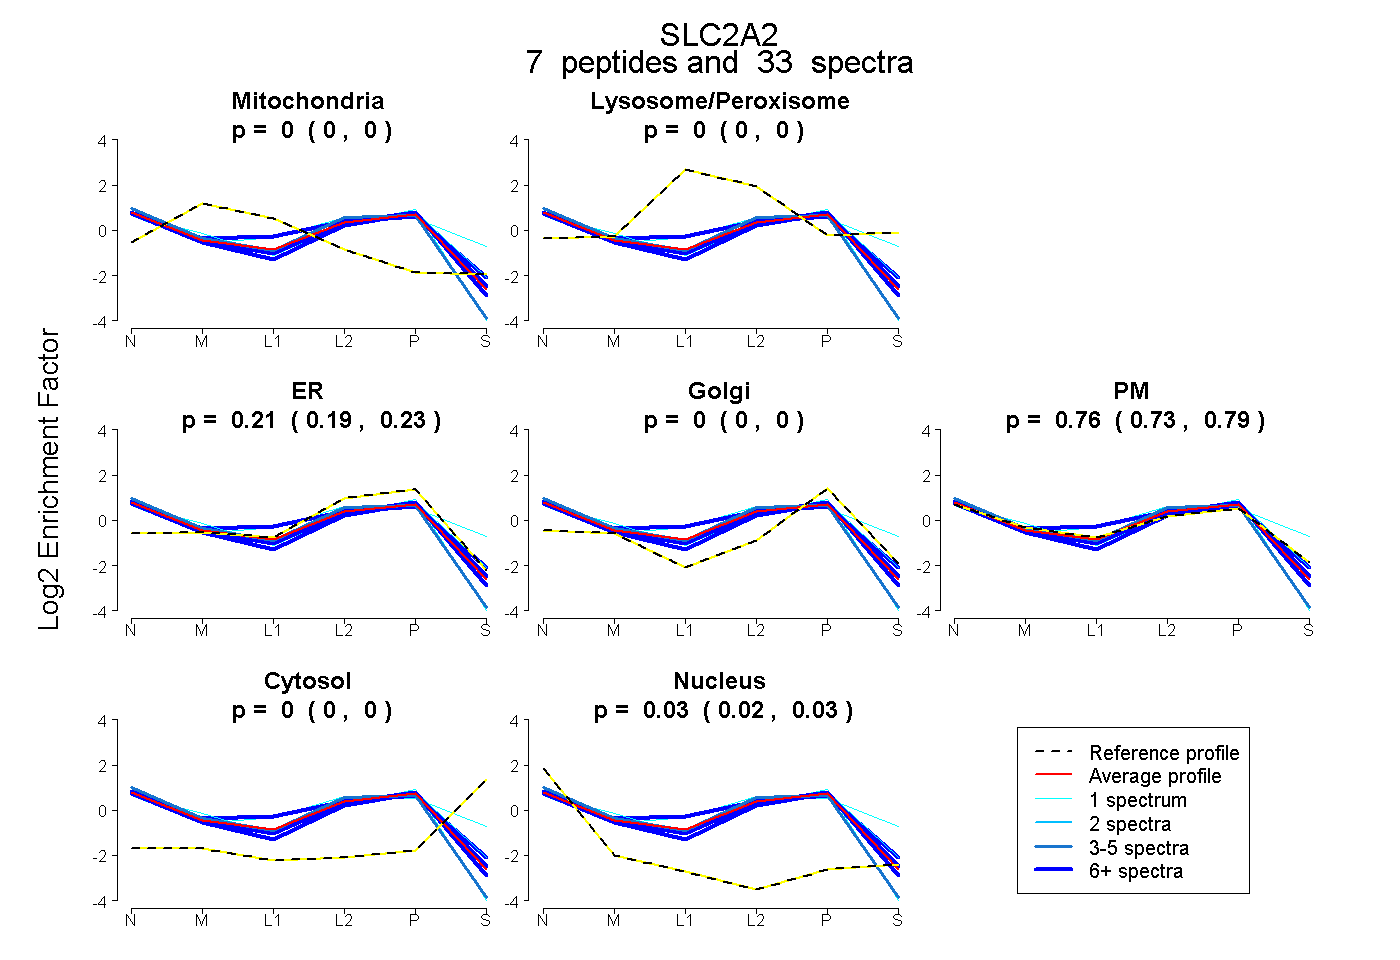 |
0.000 0.000 | 0.000 |
0.000 0.000 | 0.000 |
0.212 0.186 | 0.233 |
0.000 0.000 | 0.000 |
0.763 0.727 | 0.791 |
0.000 0.000 | 0.000 |
0.026 0.017 | 0.033 |
|||
| Plot | Lyso | Other | |||||||||||
| Expt C |
8 peptides |
181 spectra |
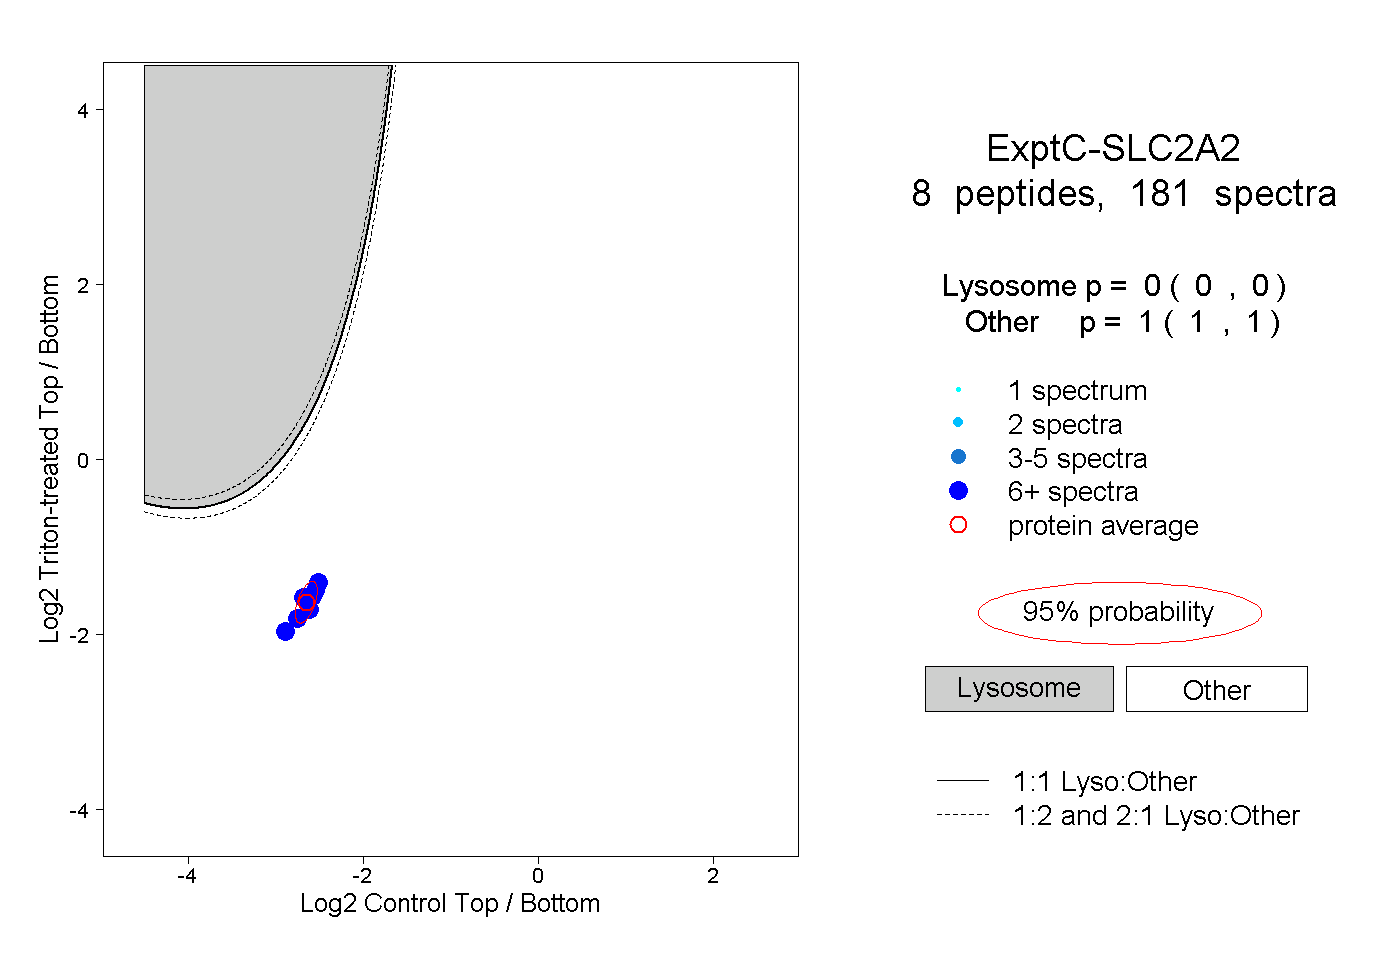 |
0.000 0.000 | 0.000 |
1.000 1.000 | 1.000 |
||||||||
| Plot | Lyso | Other | |||||||||||
| Expt D |
5 peptides |
15 spectra |
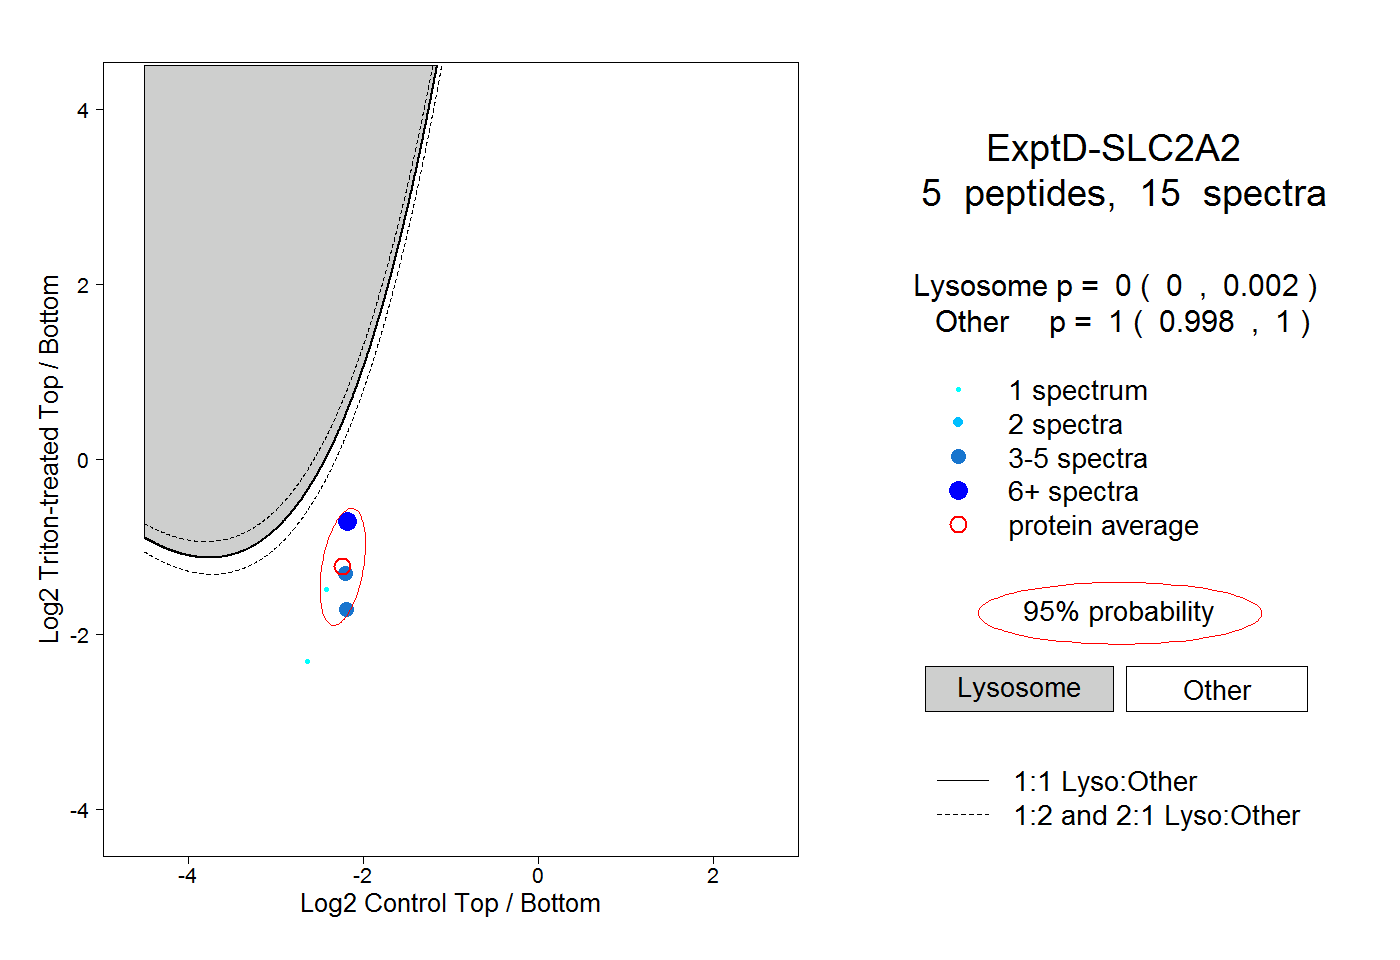 |
0.000 0.000 | 0.002 |
1.000 0.998 | 1.000 |