 32
32peptides
spectra
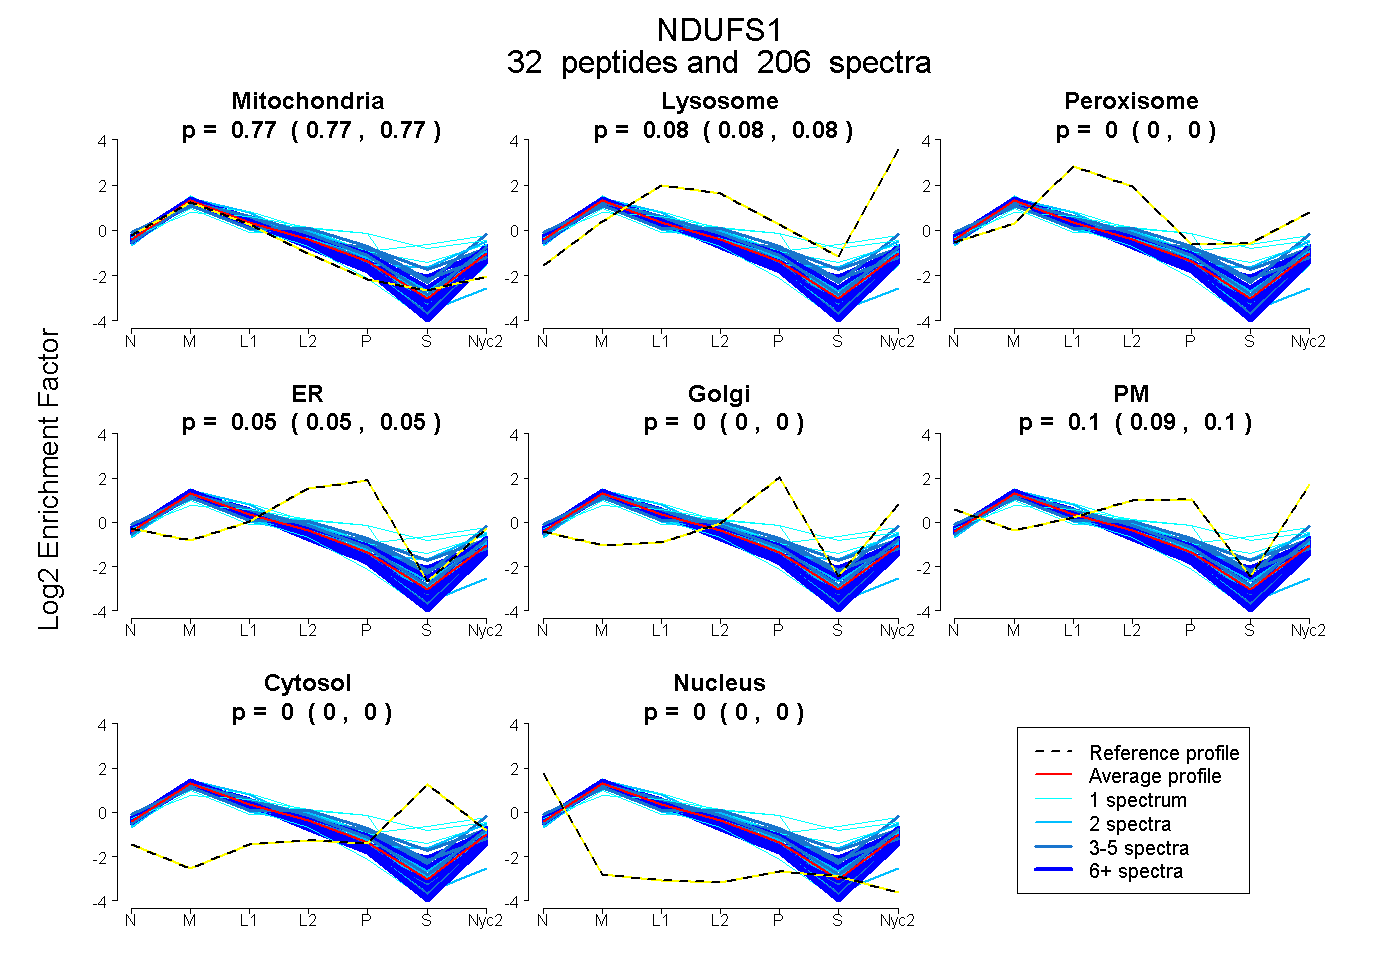
0.767 | 0.770
0.080 | 0.084
0.000 | 0.000
0.047 | 0.053
0.000 | 0.000
0.095 | 0.102
0.000 | 0.000
0.000 | 0.000
23peptides
spectra
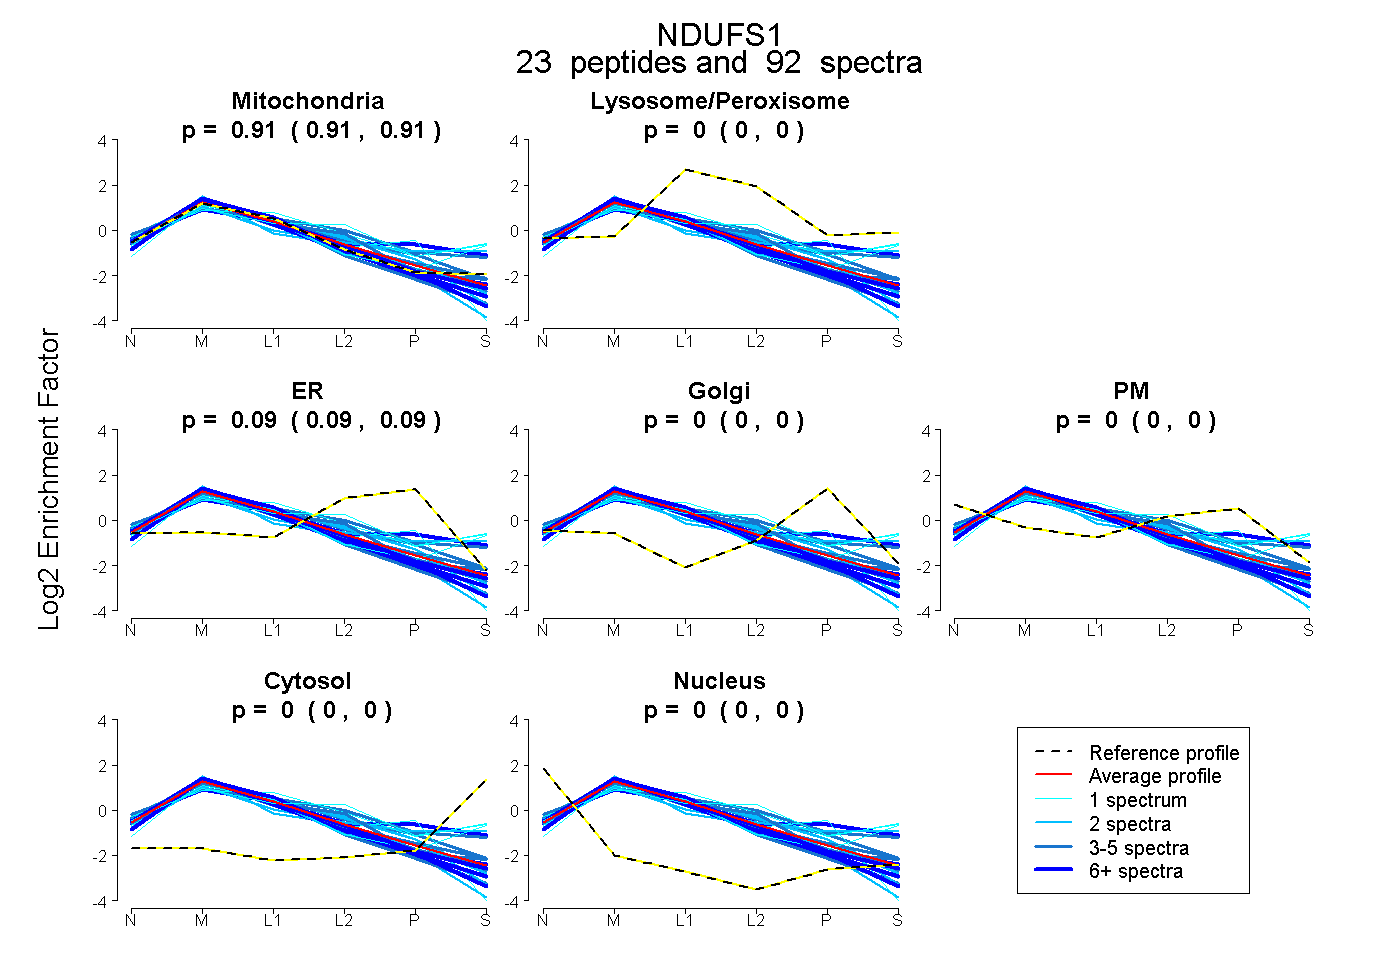
0.906 | 0.913
0.000 | 0.000
0.087 | 0.094
0.000 | 0.000
0.000 | 0.000
0.000 | 0.000
0.000 | 0.000
38peptides
spectra
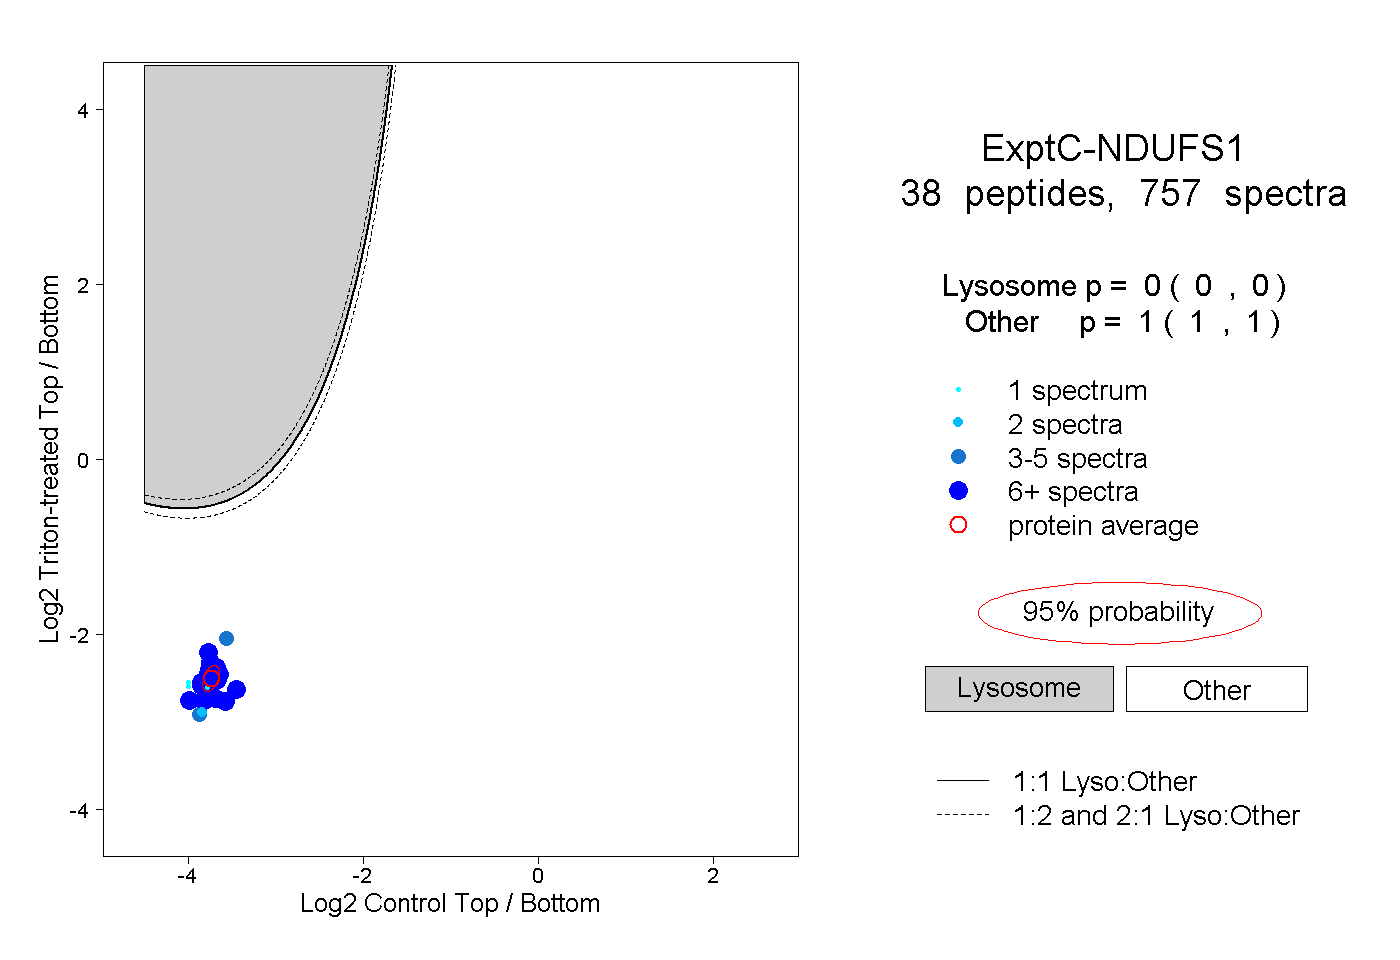
0.000 | 0.000
1.000 | 1.000
20peptides
spectra
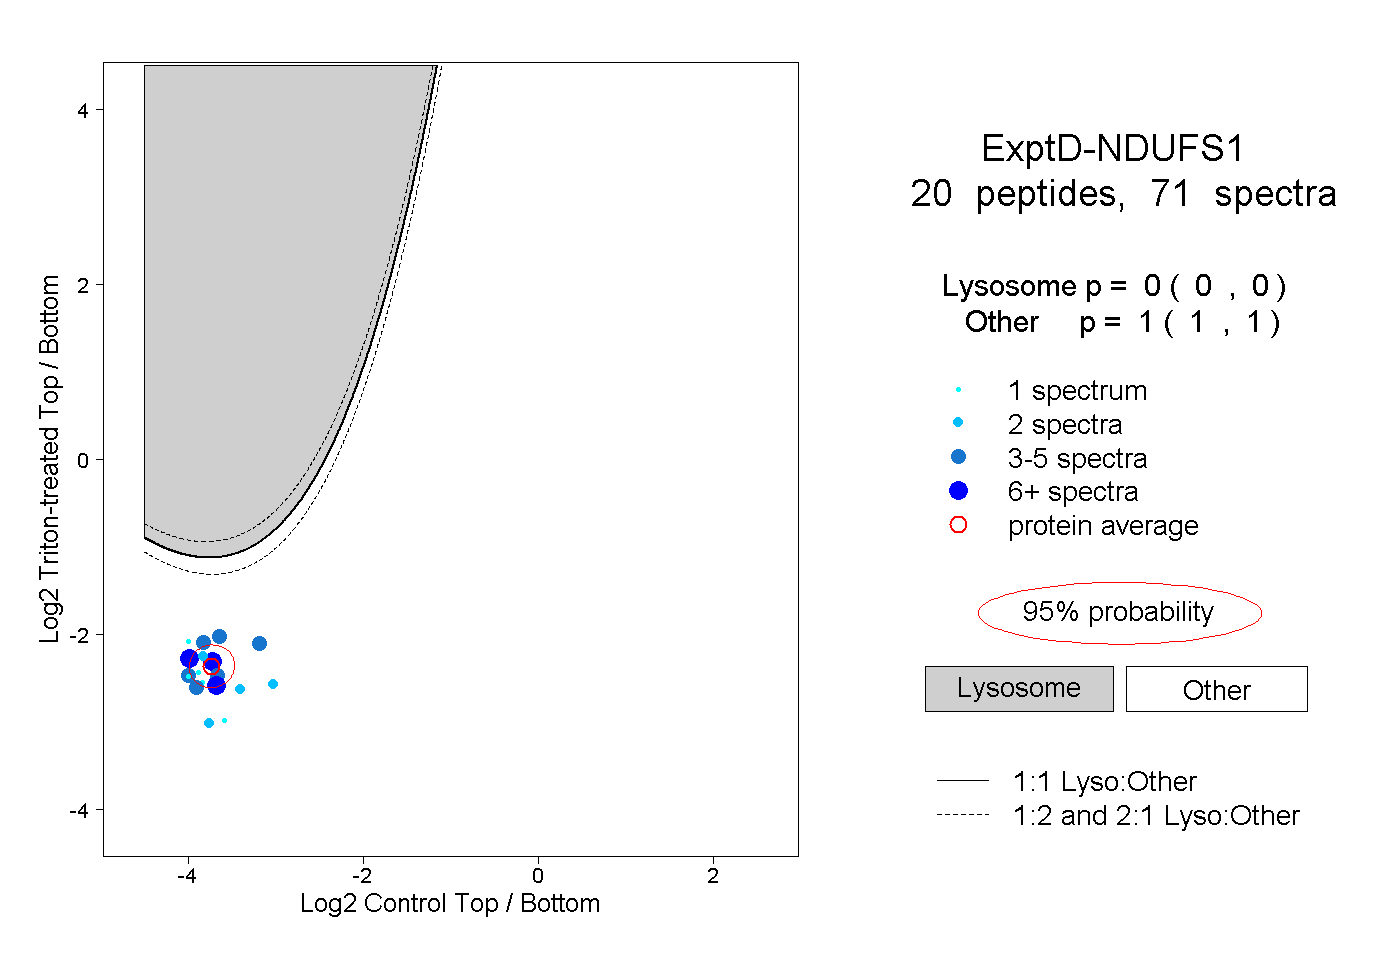
0.000 | 0.000
1.000 | 1.000