| 1 spectrum, MHEDINEEWISDK |
0.706 |
|
0.000 |
|
0.281 |
0.013 |
0.000 |
0.000 |
0.000 |
|
| 1 spectrum, SWLHNDLK |
0.559 |
|
0.310 |
|
0.000 |
0.000 |
0.026 |
0.104 |
0.000 |
|
| 4 spectra, GLLTYTSWEDALSR |
0.971 |
|
0.000 |
|
0.011 |
0.000 |
0.000 |
0.000 |
0.018 |
|
| 2 spectra, FCYHER |
0.829 |
|
0.000 |
|
0.171 |
0.000 |
0.000 |
0.000 |
0.000 |
|
| 3 spectra, LTEPMVR |
0.925 |
|
0.000 |
|
0.055 |
0.000 |
0.000 |
0.000 |
0.020 |
|
| 2 spectra, MCLVEIEK |
0.845 |
|
0.000 |
|
0.155 |
0.000 |
0.000 |
0.000 |
0.000 |
|
| 6 spectra, VAVTPPGLAR |
1.000 |
|
0.000 |
|
0.000 |
0.000 |
0.000 |
0.000 |
0.000 |
|
| 2 spectra, VALIGSPVDLTYR |
0.927 |
|
0.000 |
|
0.000 |
0.062 |
0.000 |
0.000 |
0.011 |
|
| 4 spectra, VAGMLQSFEGK |
0.928 |
|
0.006 |
|
0.066 |
0.000 |
0.000 |
0.000 |
0.000 |
|
| 8 spectra, DDGAAILAAVSSIAQK |
0.586 |
|
0.190 |
|
0.000 |
0.193 |
0.000 |
0.031 |
0.000 |
|
| 6 spectra, FEAPLFNAR |
1.000 |
|
0.000 |
|
0.000 |
0.000 |
0.000 |
0.000 |
0.000 |
|
| 1 spectrum, VVAACAMPVMK |
0.507 |
|
0.276 |
|
0.004 |
0.000 |
0.094 |
0.120 |
0.000 |
|
| 11 spectra, VMNILHR |
0.964 |
|
0.000 |
|
0.036 |
0.000 |
0.000 |
0.000 |
0.000 |
|
| 10 spectra, SATYVNTEGR |
0.964 |
|
0.000 |
|
0.003 |
0.000 |
0.000 |
0.000 |
0.033 |
|
| 2 spectra, DFYMTDSISR |
0.922 |
|
0.000 |
|
0.059 |
0.000 |
0.000 |
0.000 |
0.019 |
|
| 4 spectra, FASEIAGVDDLGTTGR |
0.949 |
|
0.000 |
|
0.051 |
0.000 |
0.000 |
0.000 |
0.000 |
|
| 2 spectra, KPMVVLGSSALQR |
0.609 |
|
0.138 |
|
0.000 |
0.145 |
0.000 |
0.108 |
0.000 |
|
| 3 spectra, LSVAGNCR |
0.965 |
|
0.000 |
|
0.000 |
0.000 |
0.000 |
0.000 |
0.035 |
|
| 3 spectra, GWNILTNSEK |
0.794 |
|
0.028 |
|
0.140 |
0.000 |
0.038 |
0.000 |
0.000 |
|
| 3 spectra, IASQVAALDLGYKPGVEAIR |
0.585 |
|
0.206 |
|
0.000 |
0.000 |
0.193 |
0.017 |
0.000 |
|
| 9 spectra, LGEVSPNLVR |
0.987 |
|
0.000 |
|
0.000 |
0.000 |
0.000 |
0.000 |
0.013 |
|
| 1 spectrum, VLNAAK |
0.744 |
|
0.085 |
|
0.000 |
0.000 |
0.000 |
0.171 |
0.000 |
|
| 4 spectra, VGMQIPR |
0.905 |
|
0.000 |
|
0.064 |
0.031 |
0.000 |
0.000 |
0.000 |
|
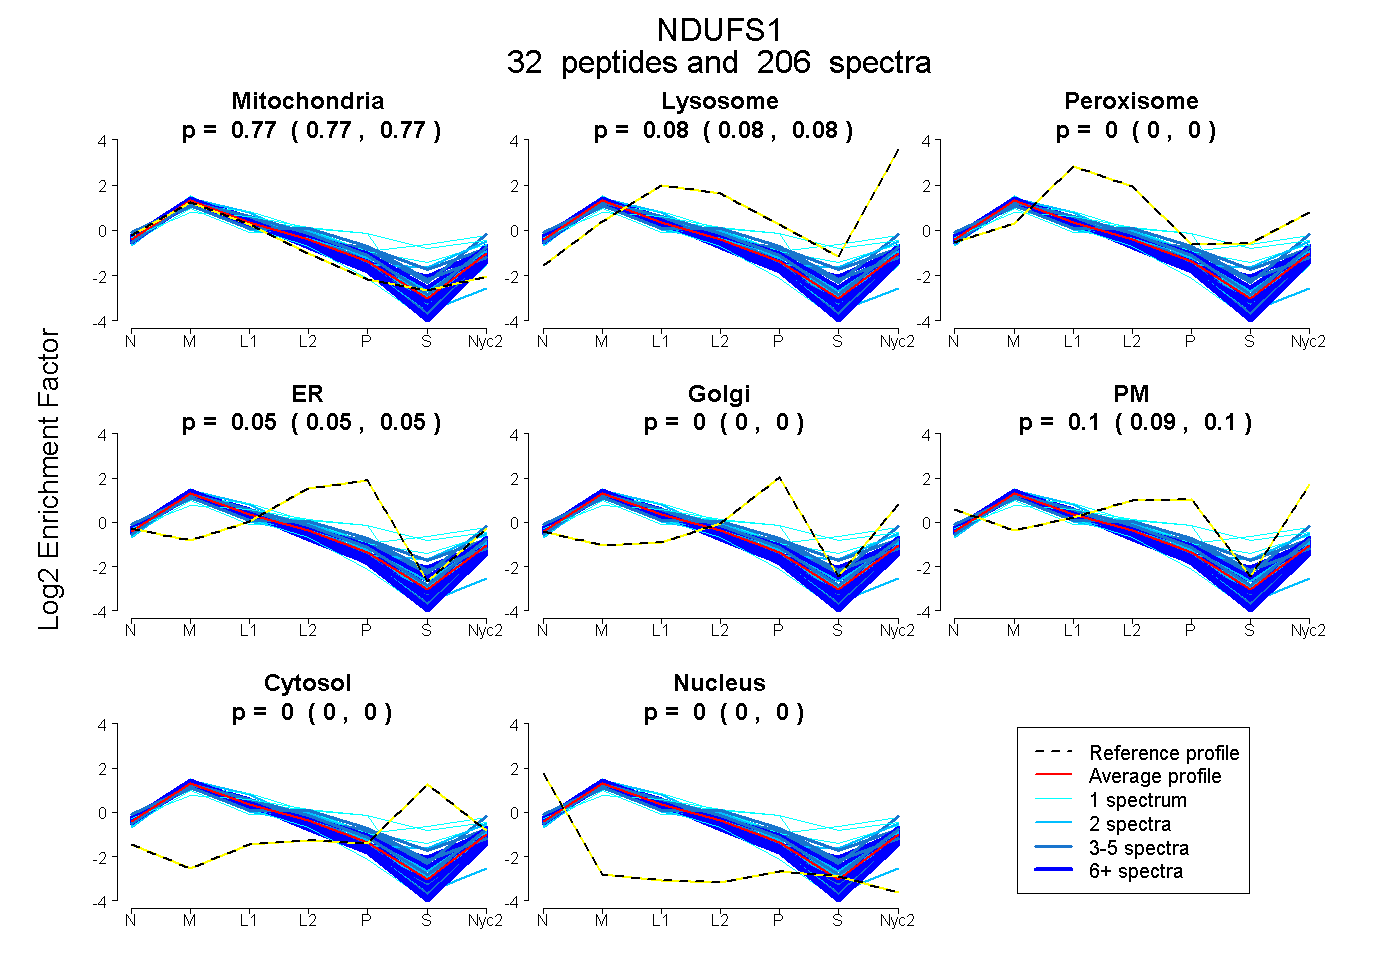
 32
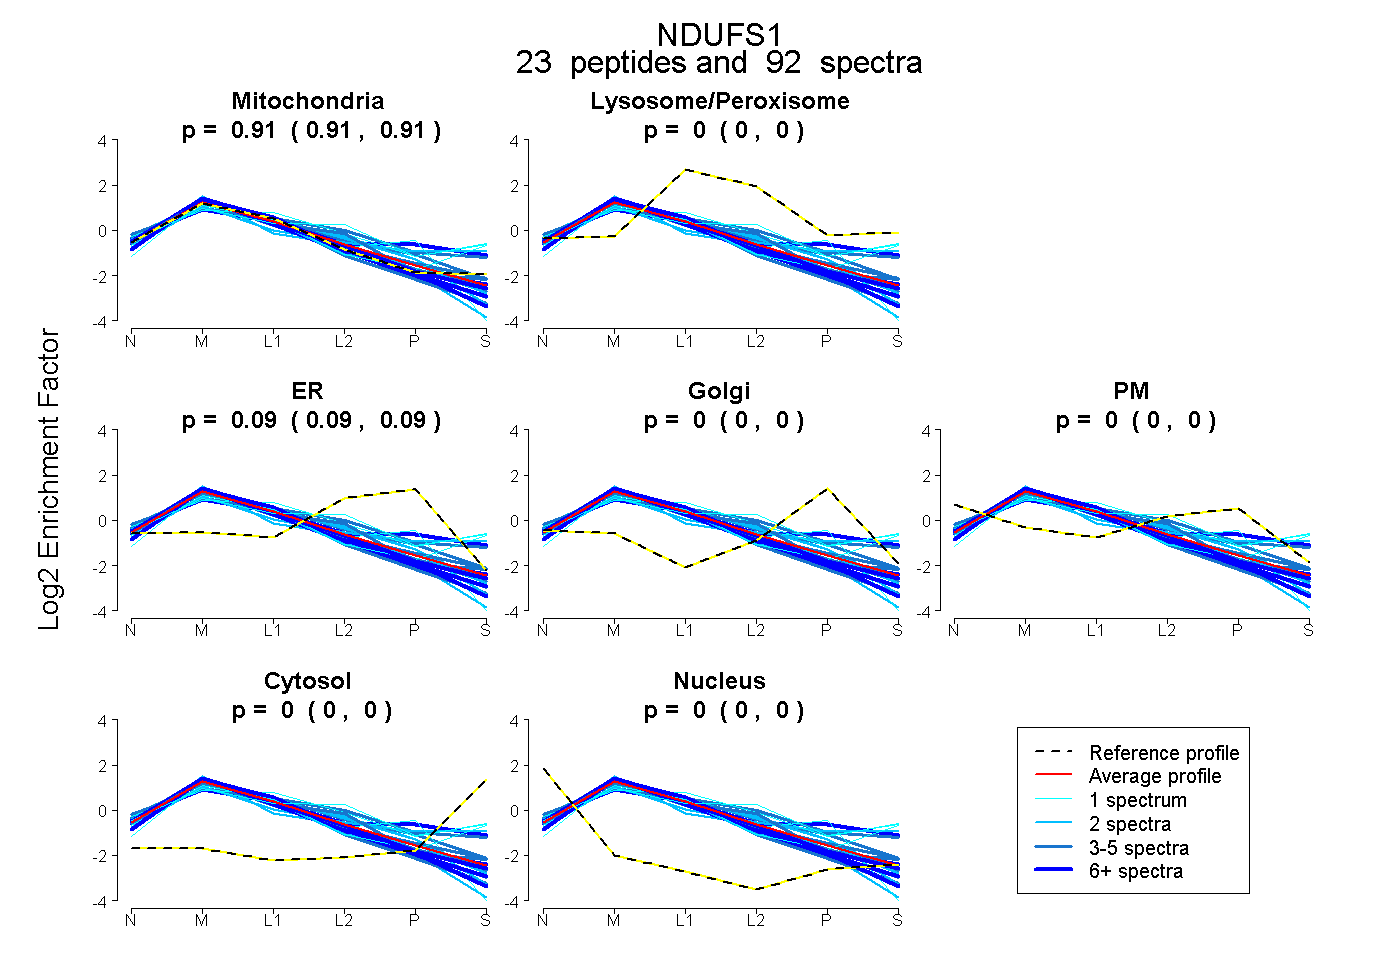
32