8
8peptides
spectra
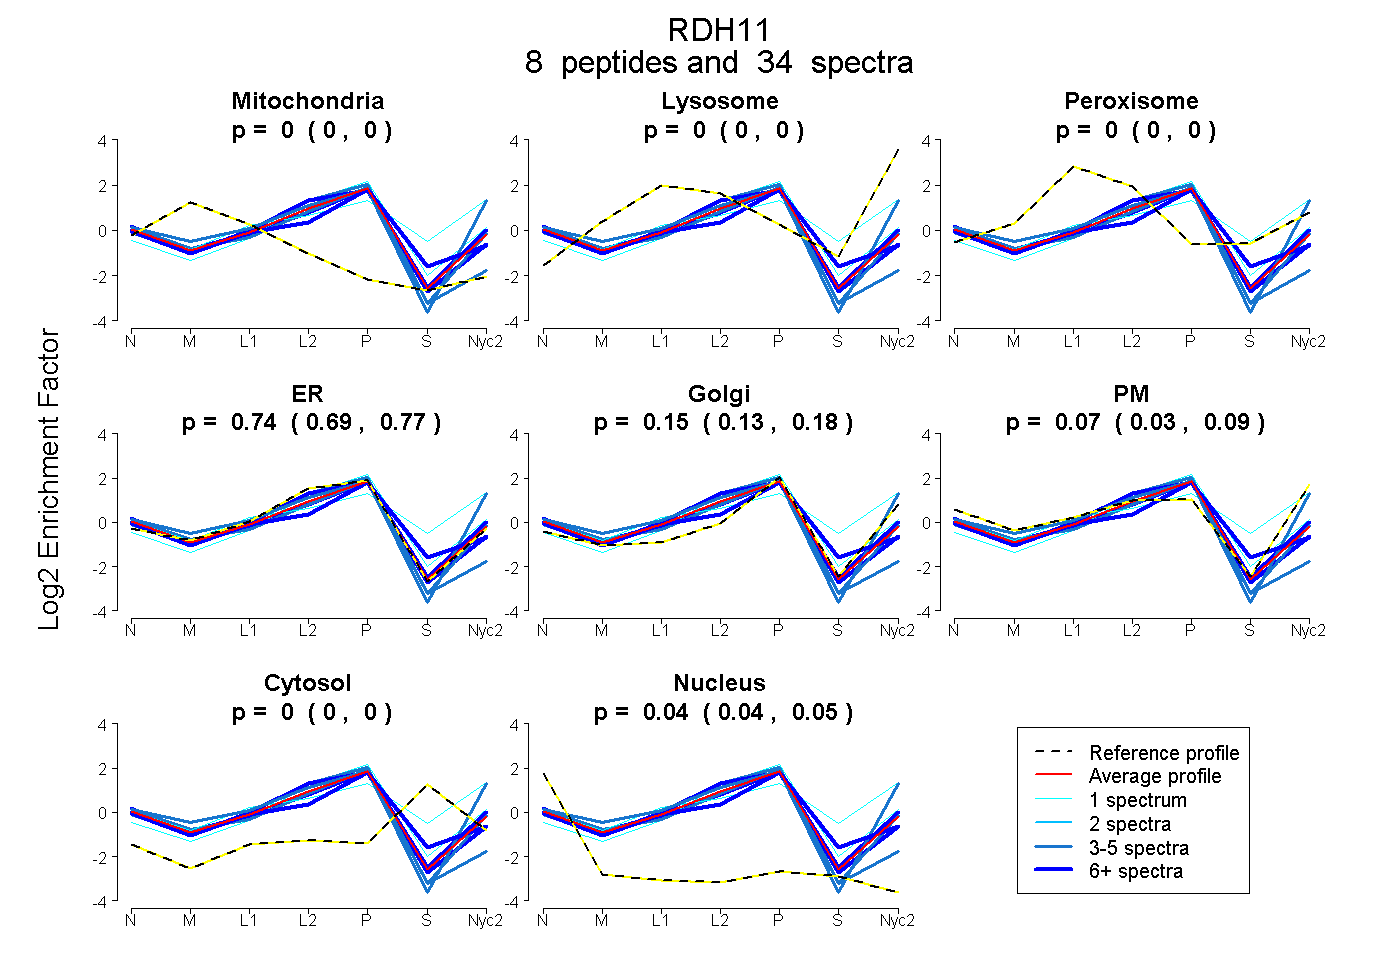
0.000 | 0.000
0.000 | 0.000
0.000 | 0.004
0.689 | 0.772
0.129 | 0.177
0.034 | 0.093
0.000 | 0.000
0.035 | 0.049
6peptides
spectra
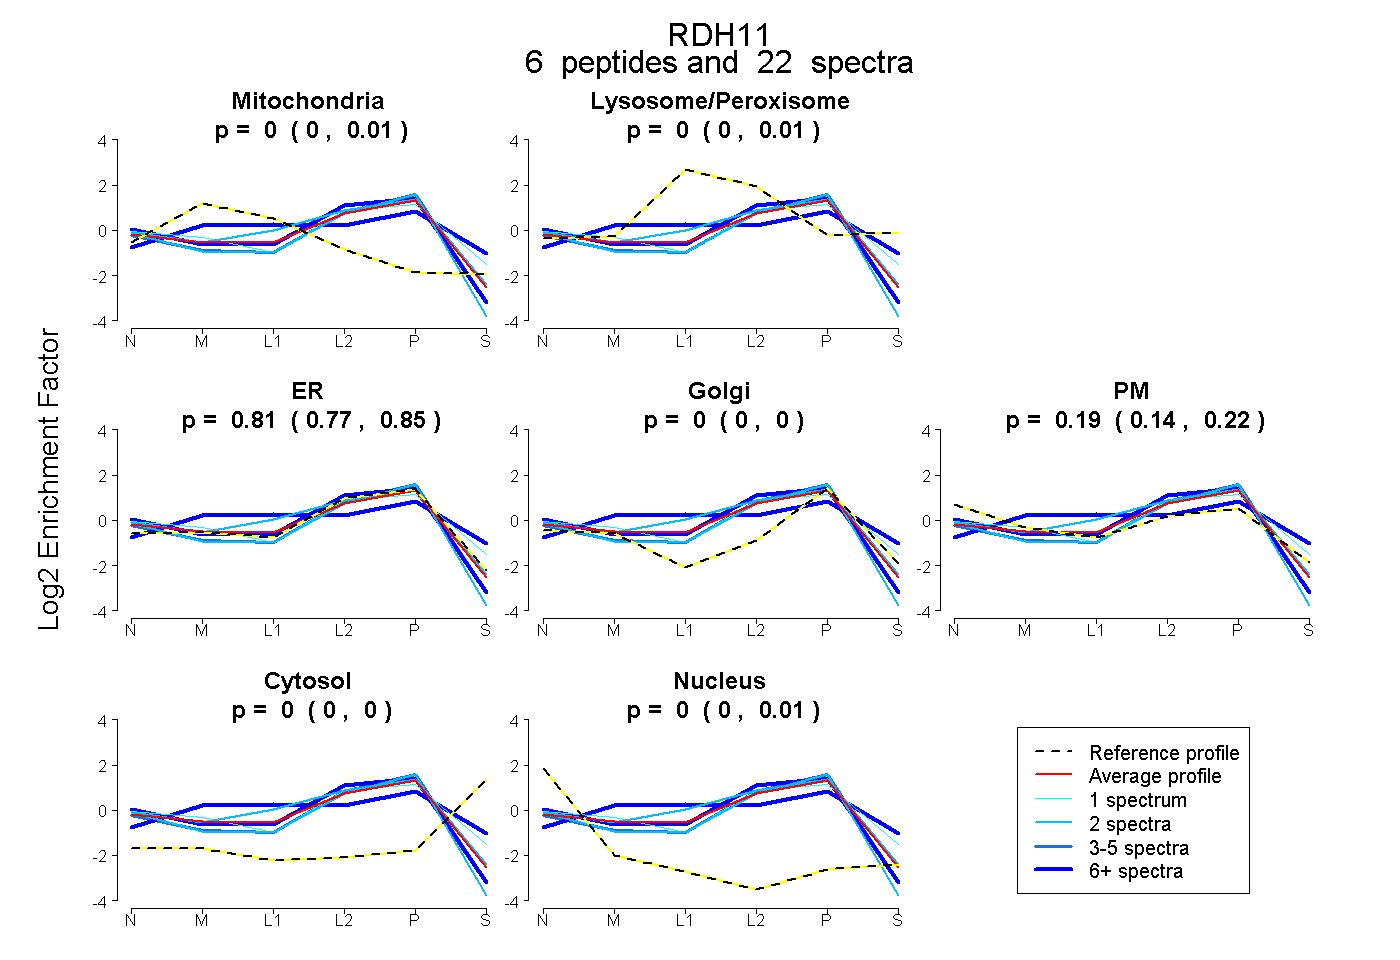
0.000 | 0.008
0.000 | 0.009
0.773 | 0.845
0.000 | 0.000
0.137 | 0.217
0.000 | 0.000
0.000 | 0.007
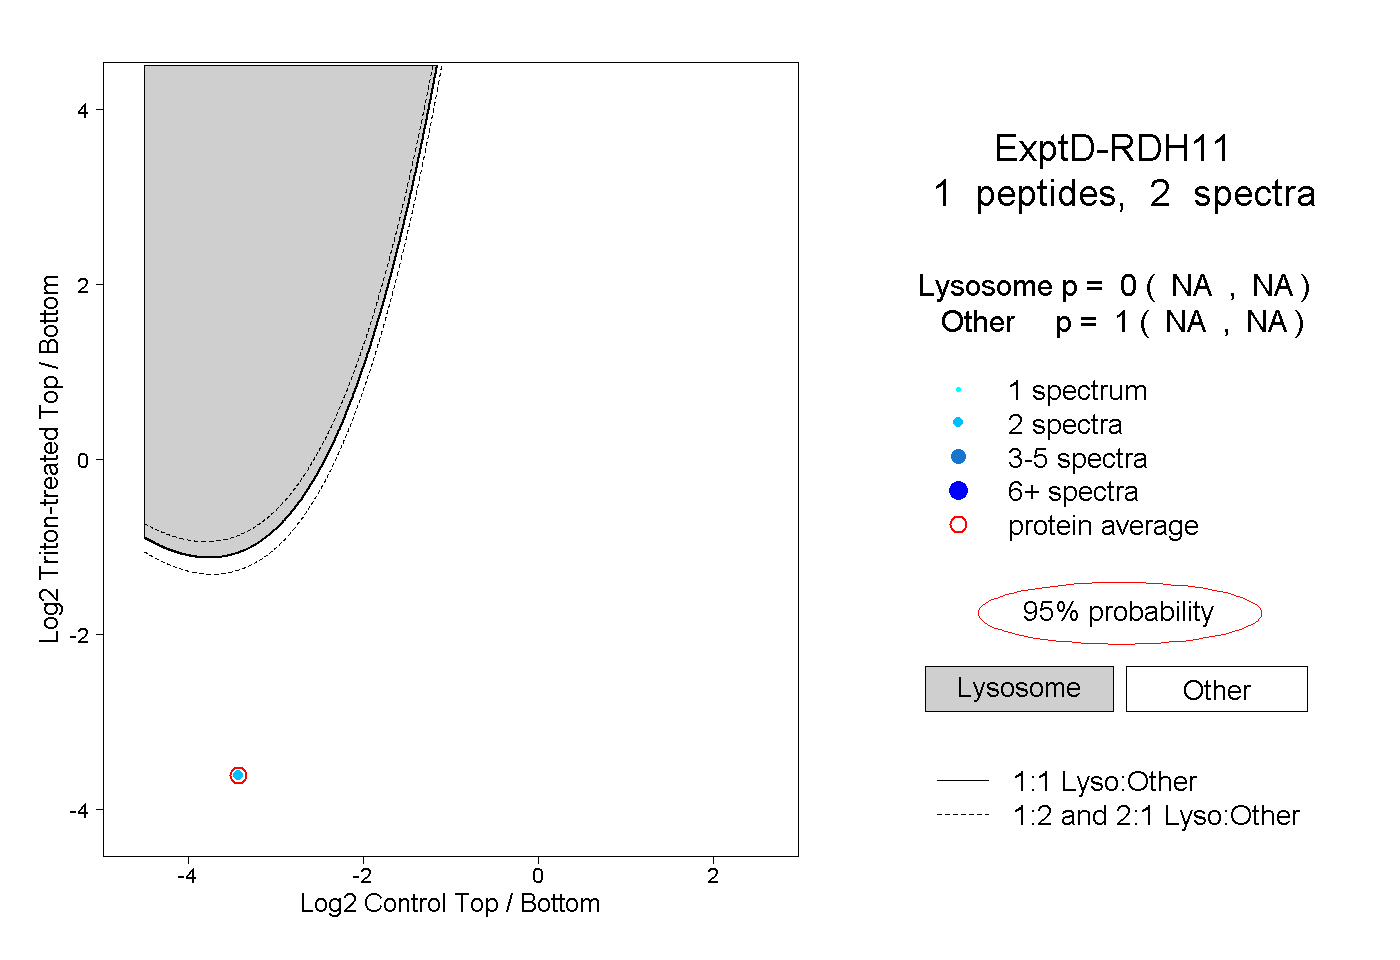
9peptides
spectra
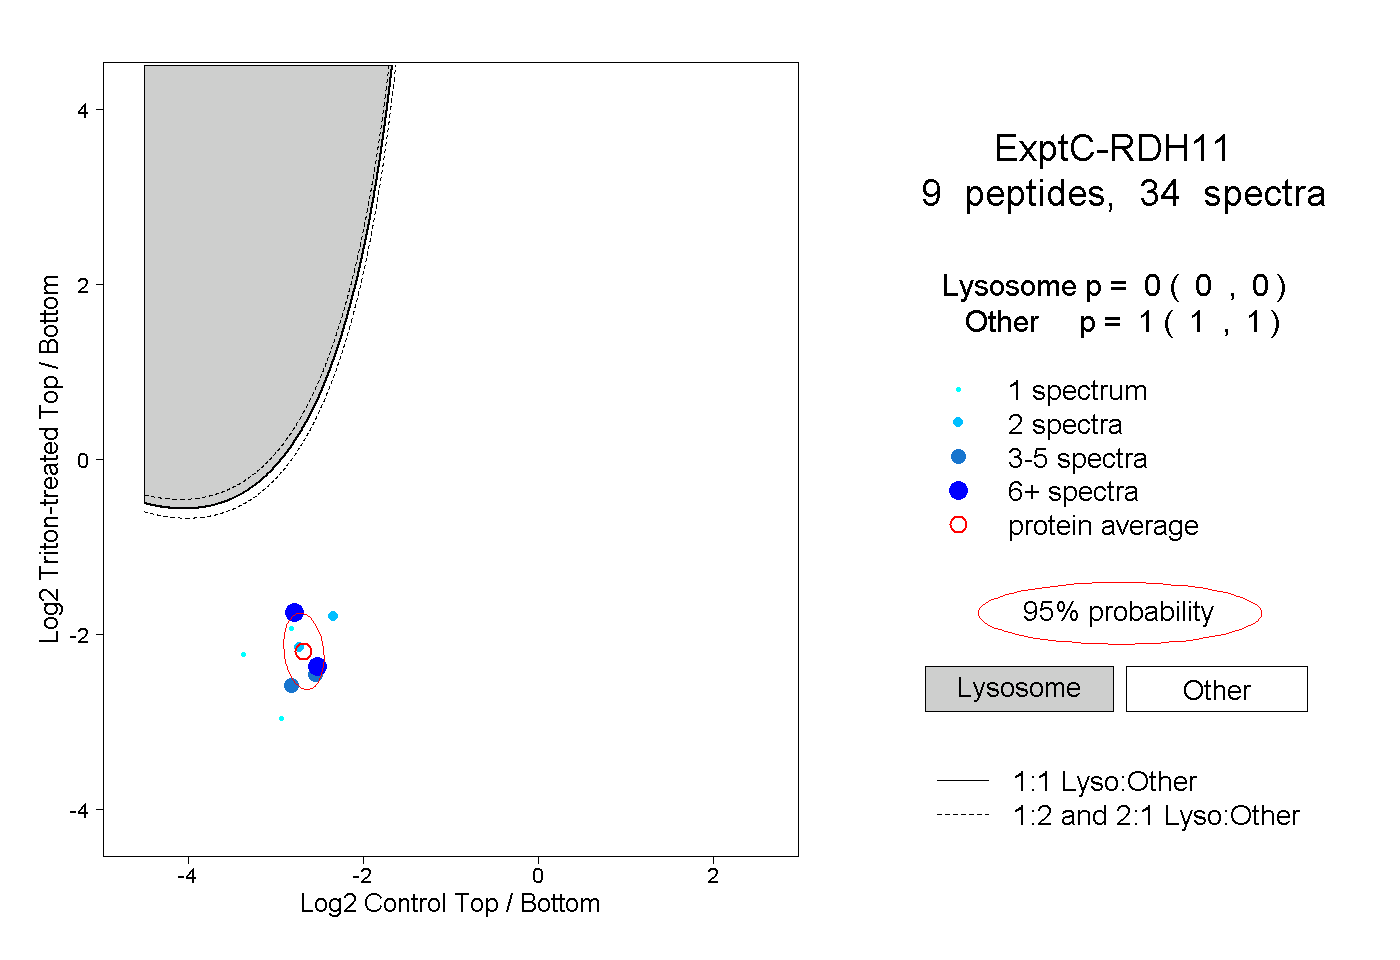
0.000 | 0.000
1.000 | 1.000