 3
3peptides
spectra
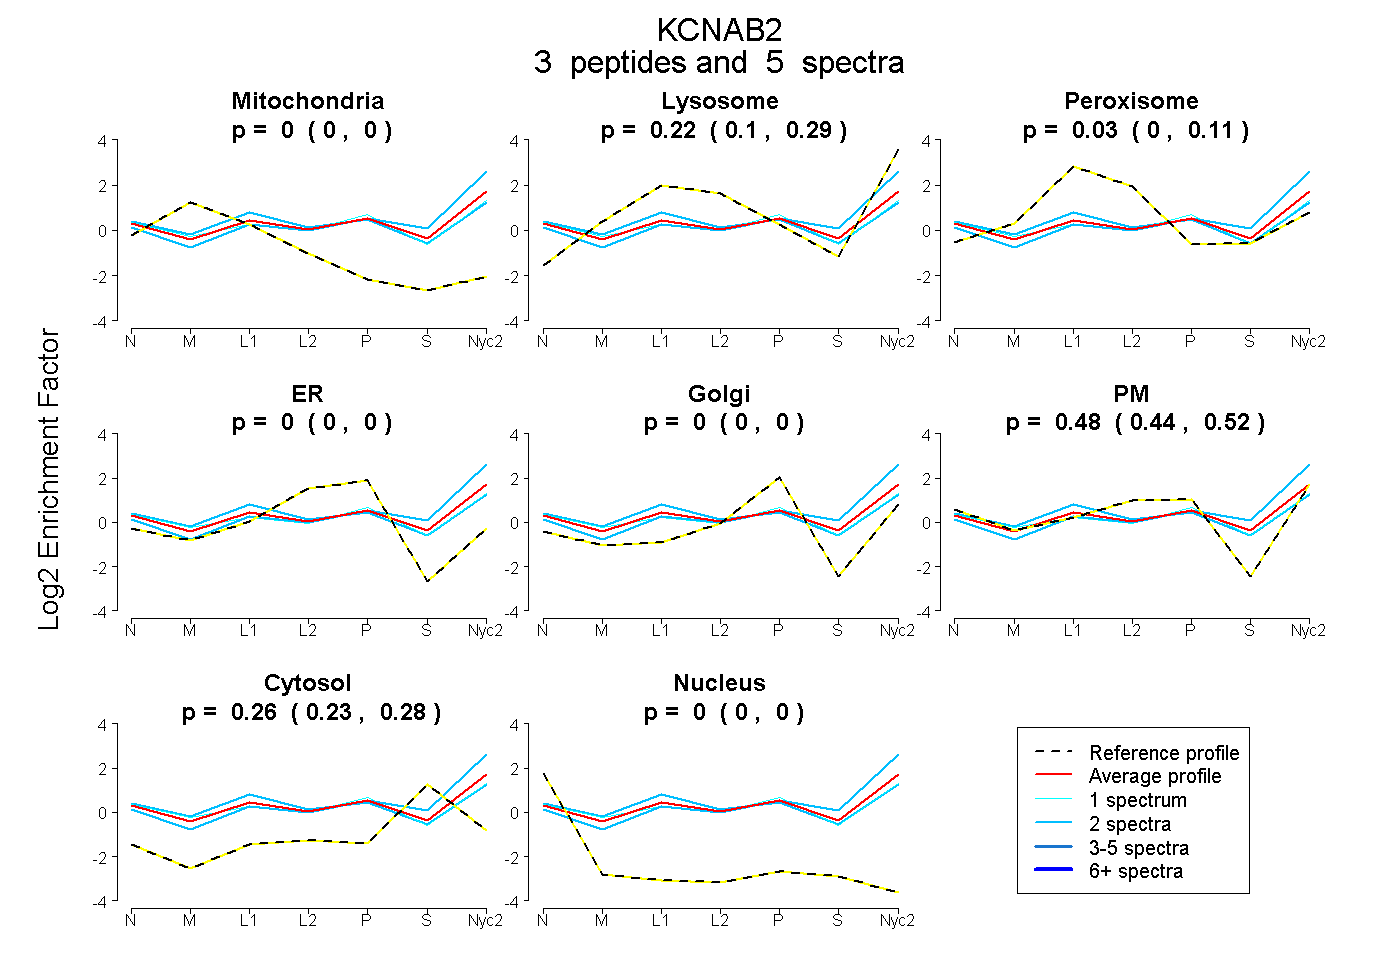
0.000 | 0.000
0.103 | 0.292
0.000 | 0.114
0.000 | 0.000
0.000 | 0.000
0.436 | 0.523
0.231 | 0.280
0.000 | 0.000
1peptide
spectra
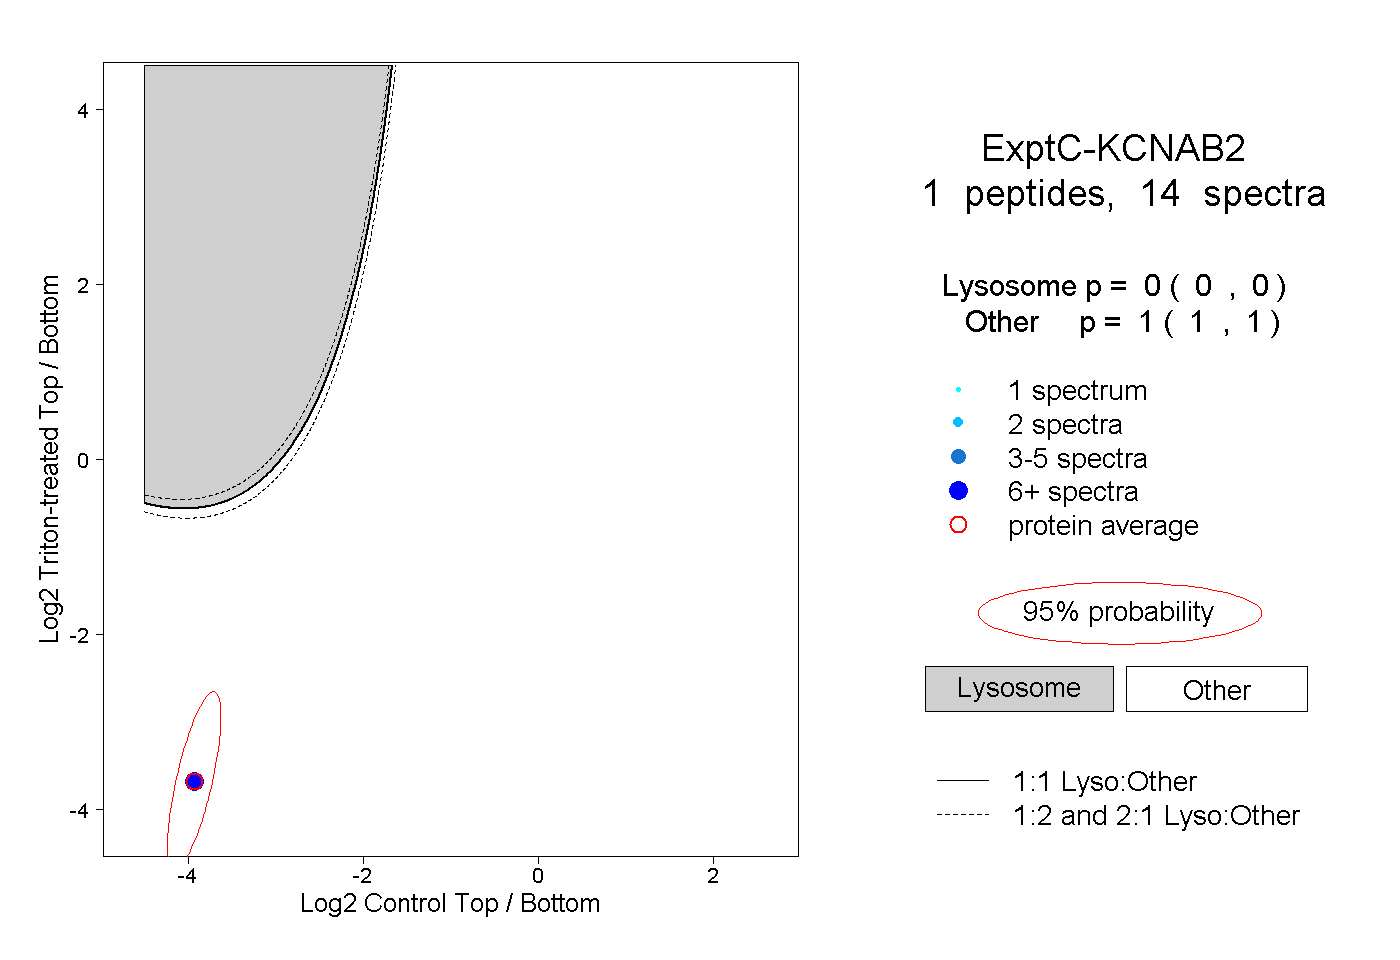
0.000 | 0.000
1.000 | 1.000
| Plot | Mito | Lyso | Perox | ER | Golgi | PM | Cytosol | Nucleus | |||||
| Expt A |
3 peptides |
5 spectra |
|
0.000 0.000 | 0.000 |
0.222 0.103 | 0.292 |
0.035 0.000 | 0.114 |
0.000 0.000 | 0.000 |
0.000 0.000 | 0.000 |
0.485 0.436 | 0.523 |
0.259 0.231 | 0.280 |
0.000 0.000 | 0.000 |
||
| Plot | Lyso | Other | |||||||||||
| Expt C |
1 peptide |
14 spectra |
|
0.000 0.000 | 0.000 |
1.000 1.000 | 1.000 |