 2
2peptides
spectra
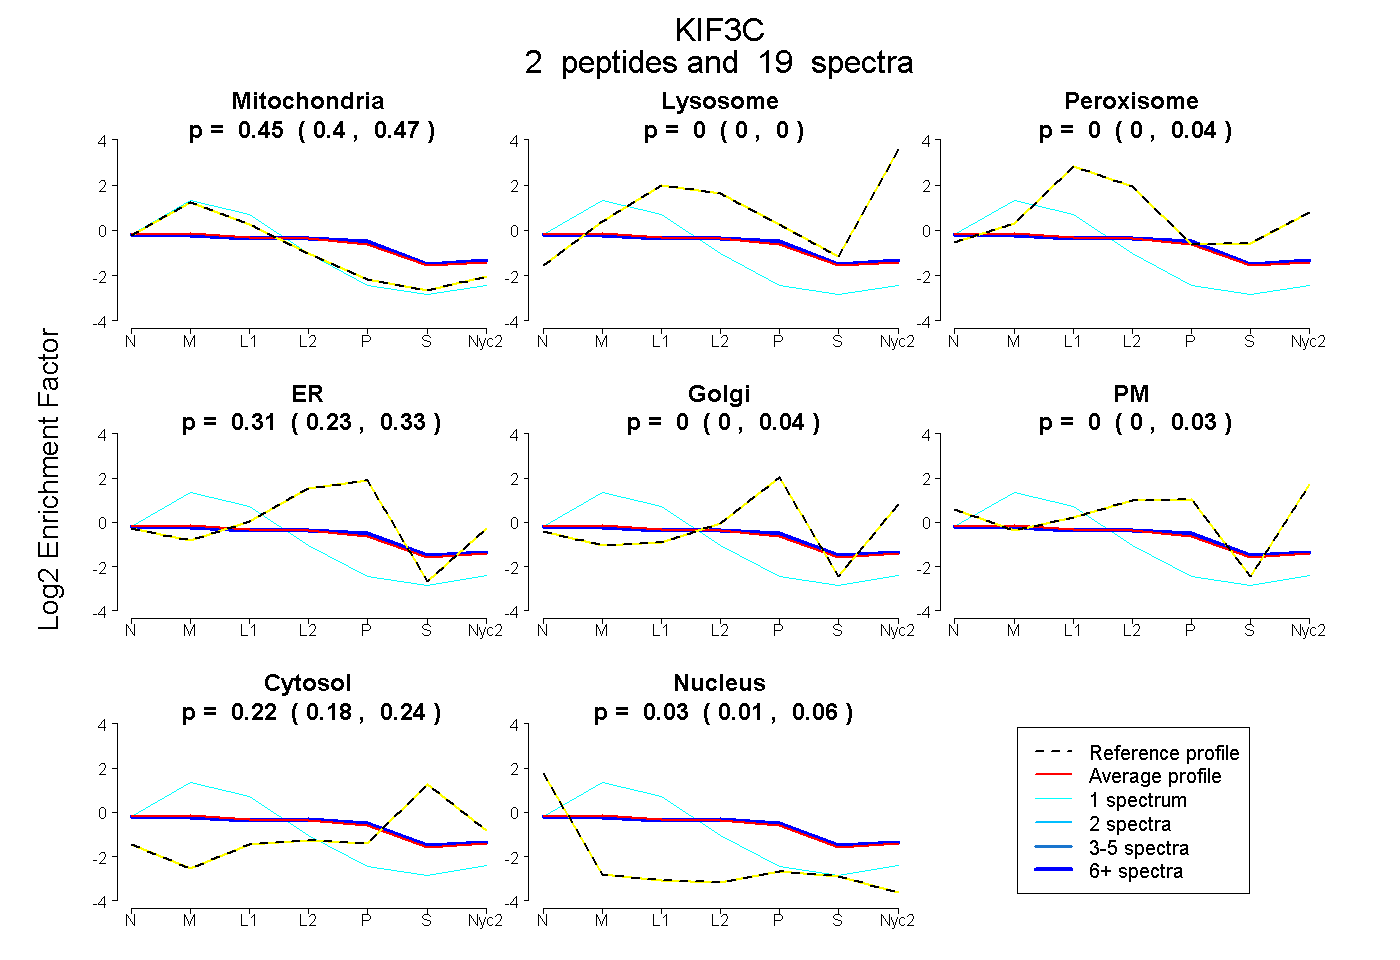
0.400 | 0.473
0.000 | 0.000
0.000 | 0.041
0.226 | 0.333
0.000 | 0.037
0.000 | 0.032
0.180 | 0.237
0.012 | 0.057
2peptides
spectra
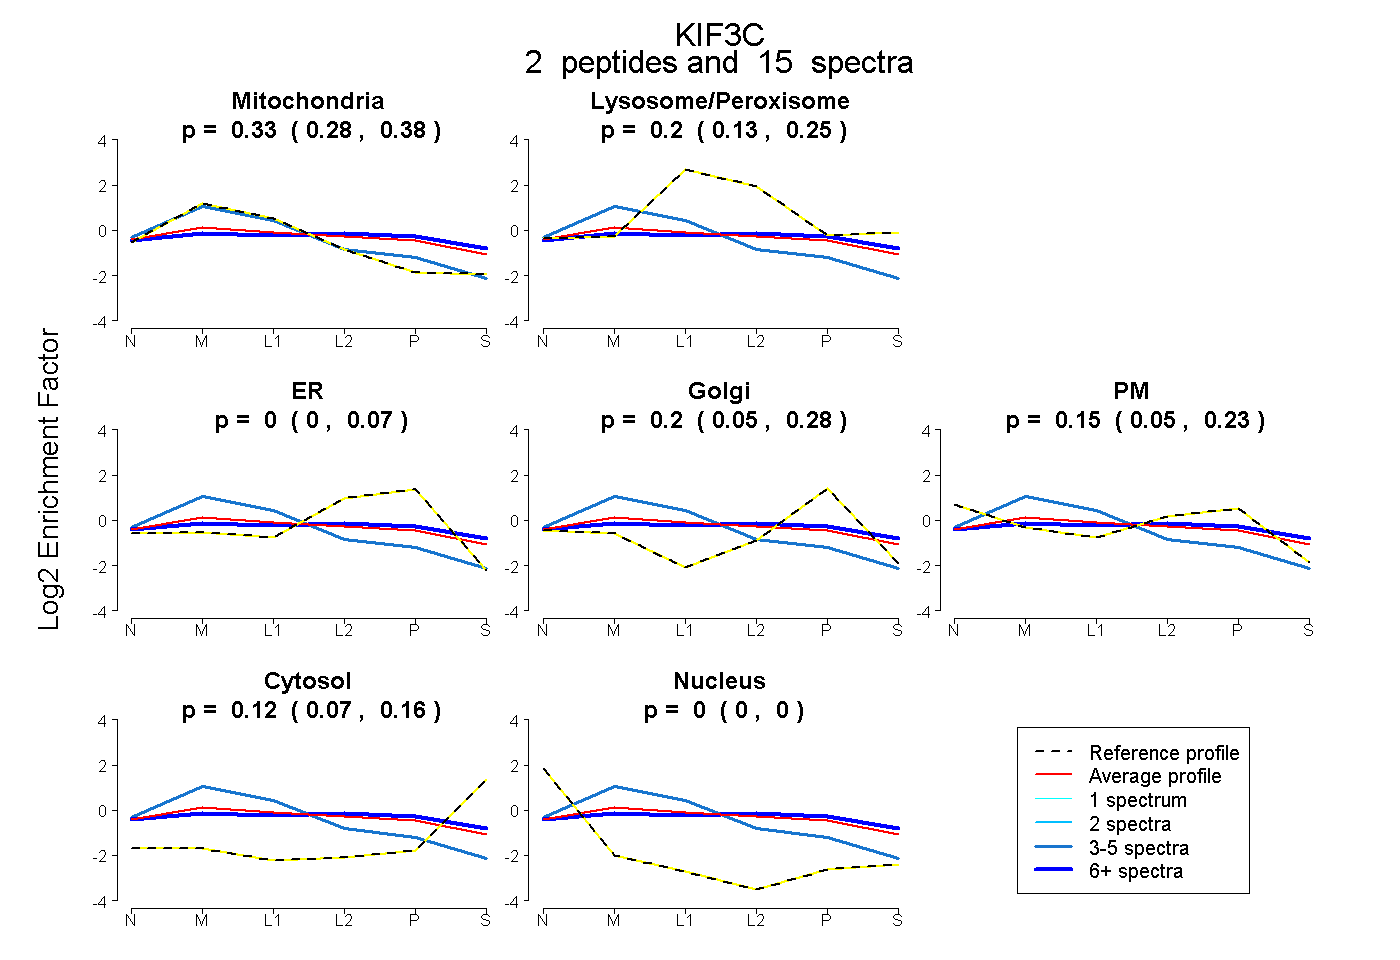
0.278 | 0.378
0.125 | 0.246
0.000 | 0.072
0.047 | 0.277
0.051 | 0.228
0.068 | 0.161
0.000 | 0.000
2peptides
spectra
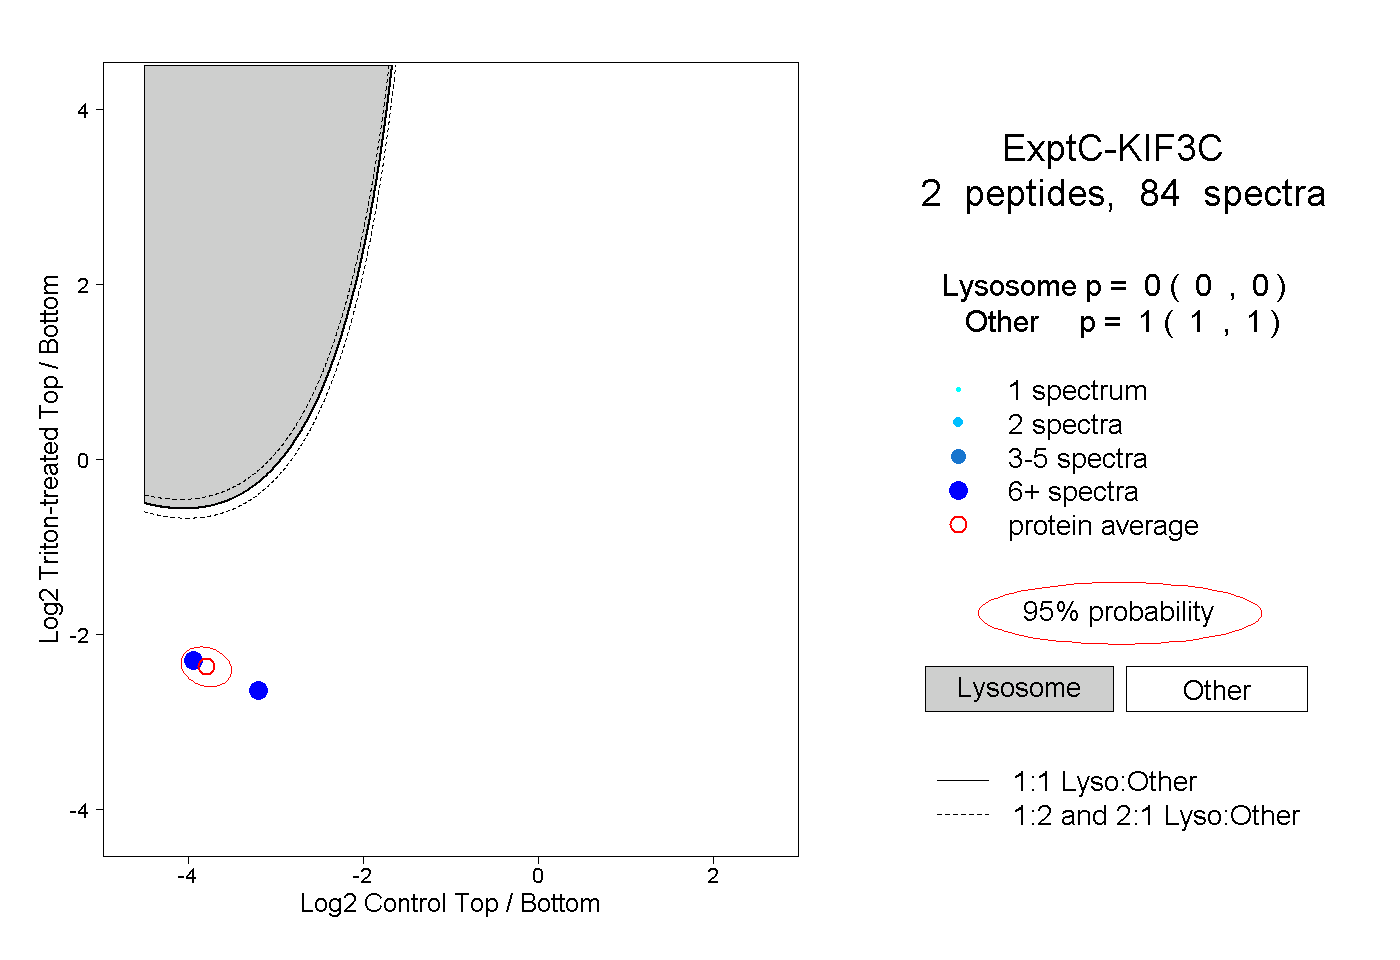
0.000 | 0.000
1.000 | 1.000
2peptides
spectra
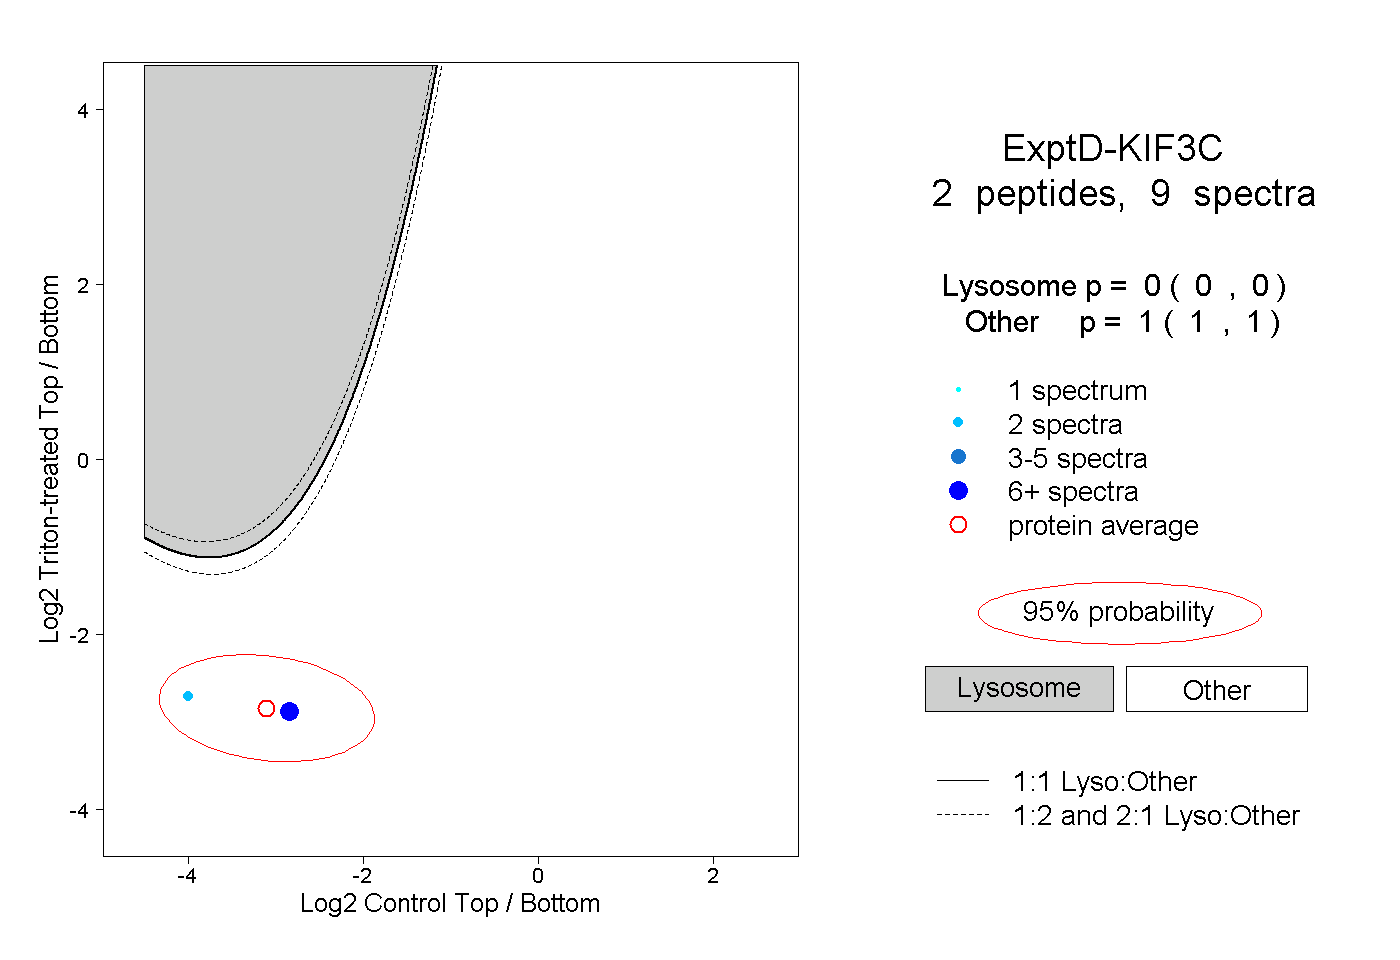
0.000 | 0.000
1.000 | 1.000