 5
5peptides
spectra
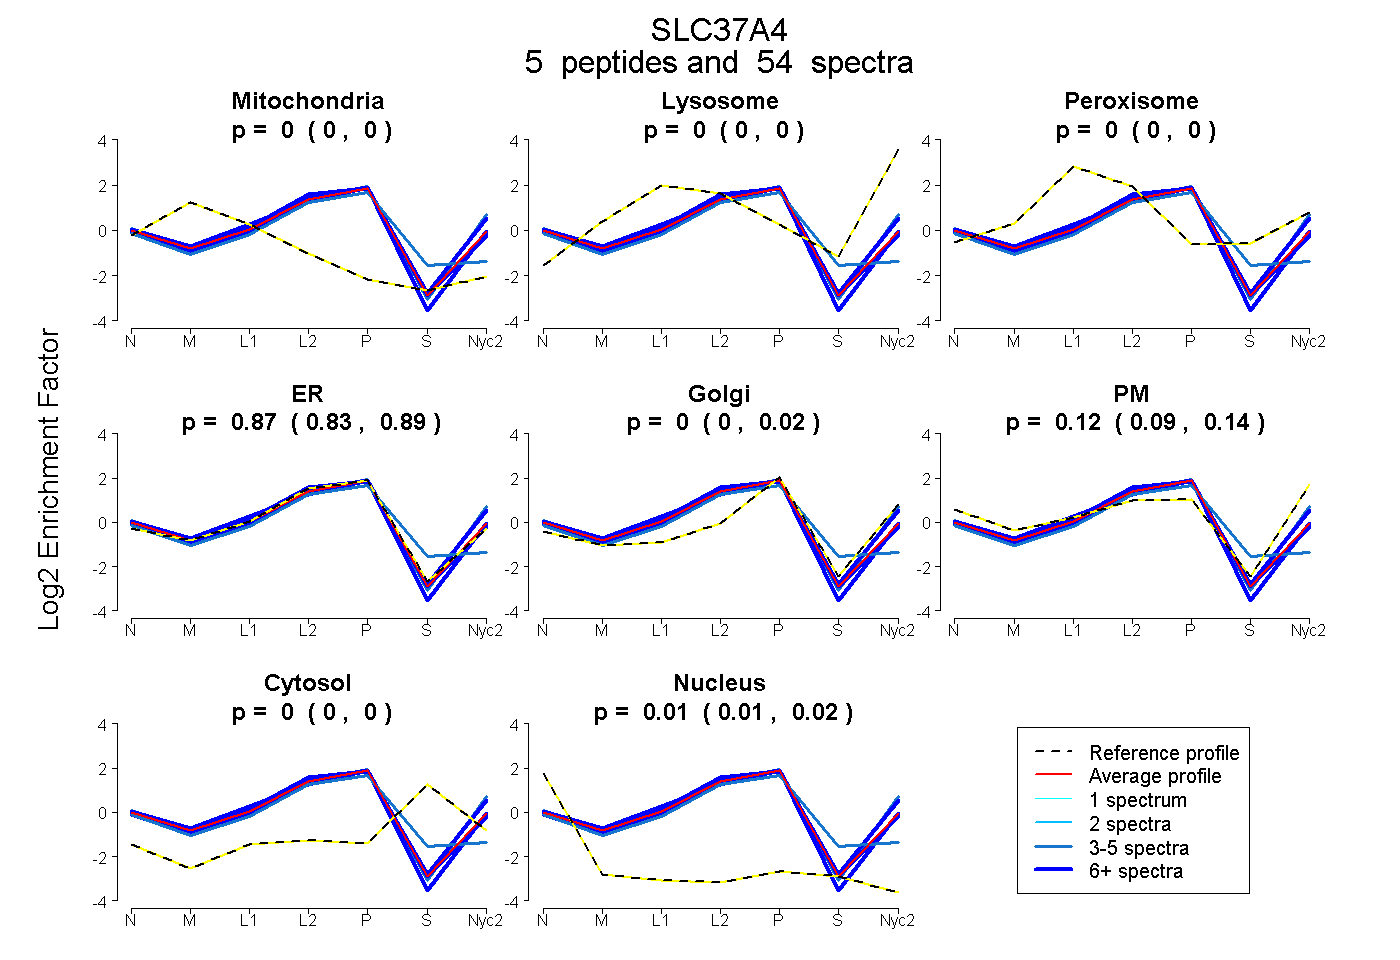
0.000 | 0.000
0.000 | 0.000
0.000 | 0.000
0.833 | 0.891
0.000 | 0.017
0.088 | 0.140
0.000 | 0.000
0.006 | 0.016
3peptides
spectra
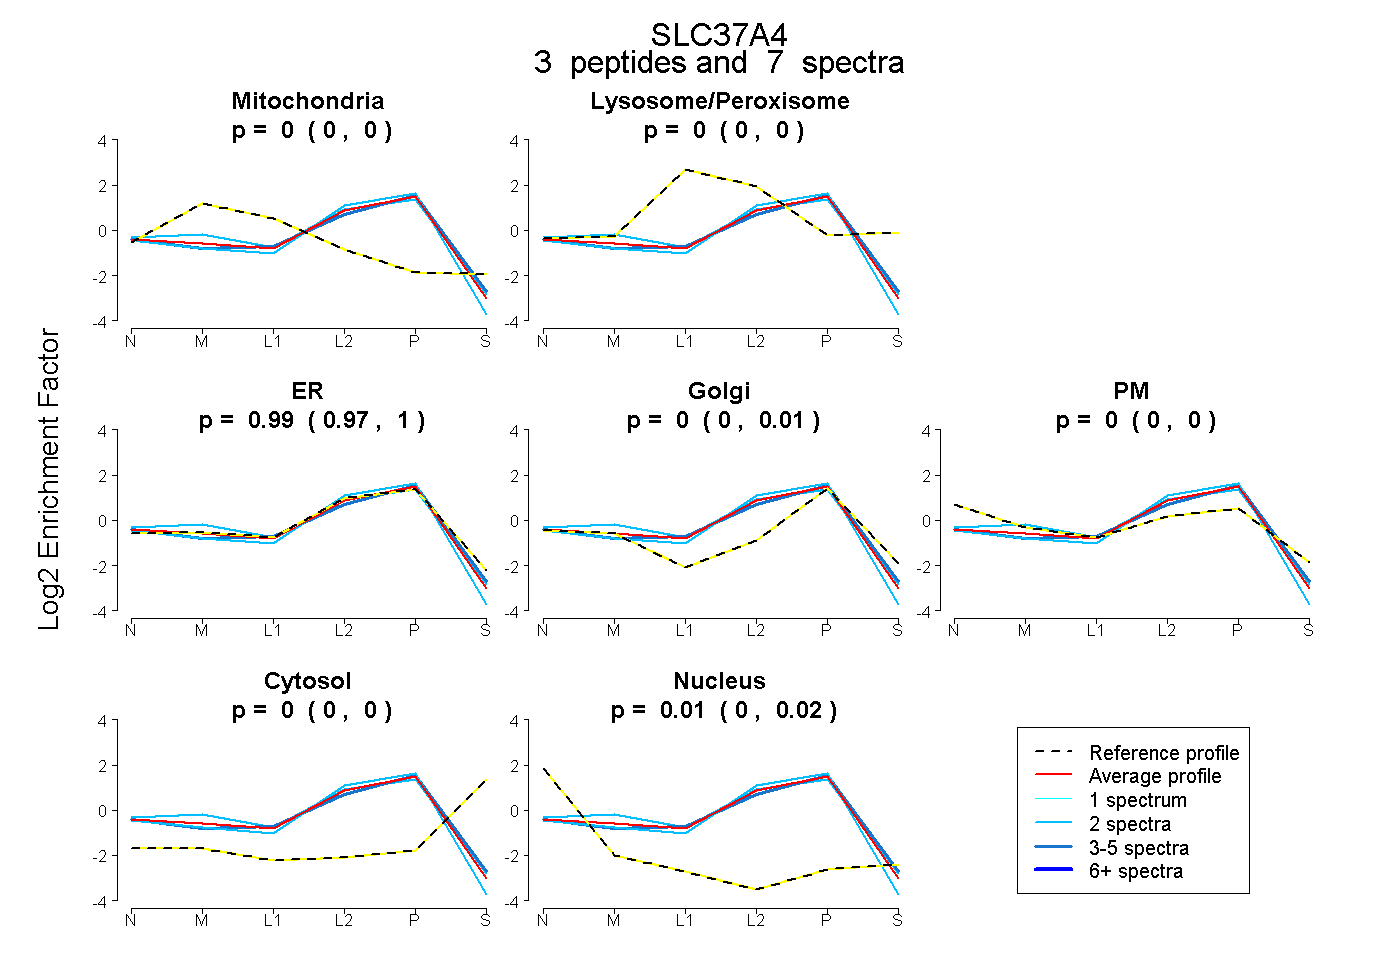
0.000 | 0.000
0.000 | 0.000
0.969 | 0.996
0.000 | 0.006
0.000 | 0.000
0.000 | 0.000
0.002 | 0.023
5peptides
spectra
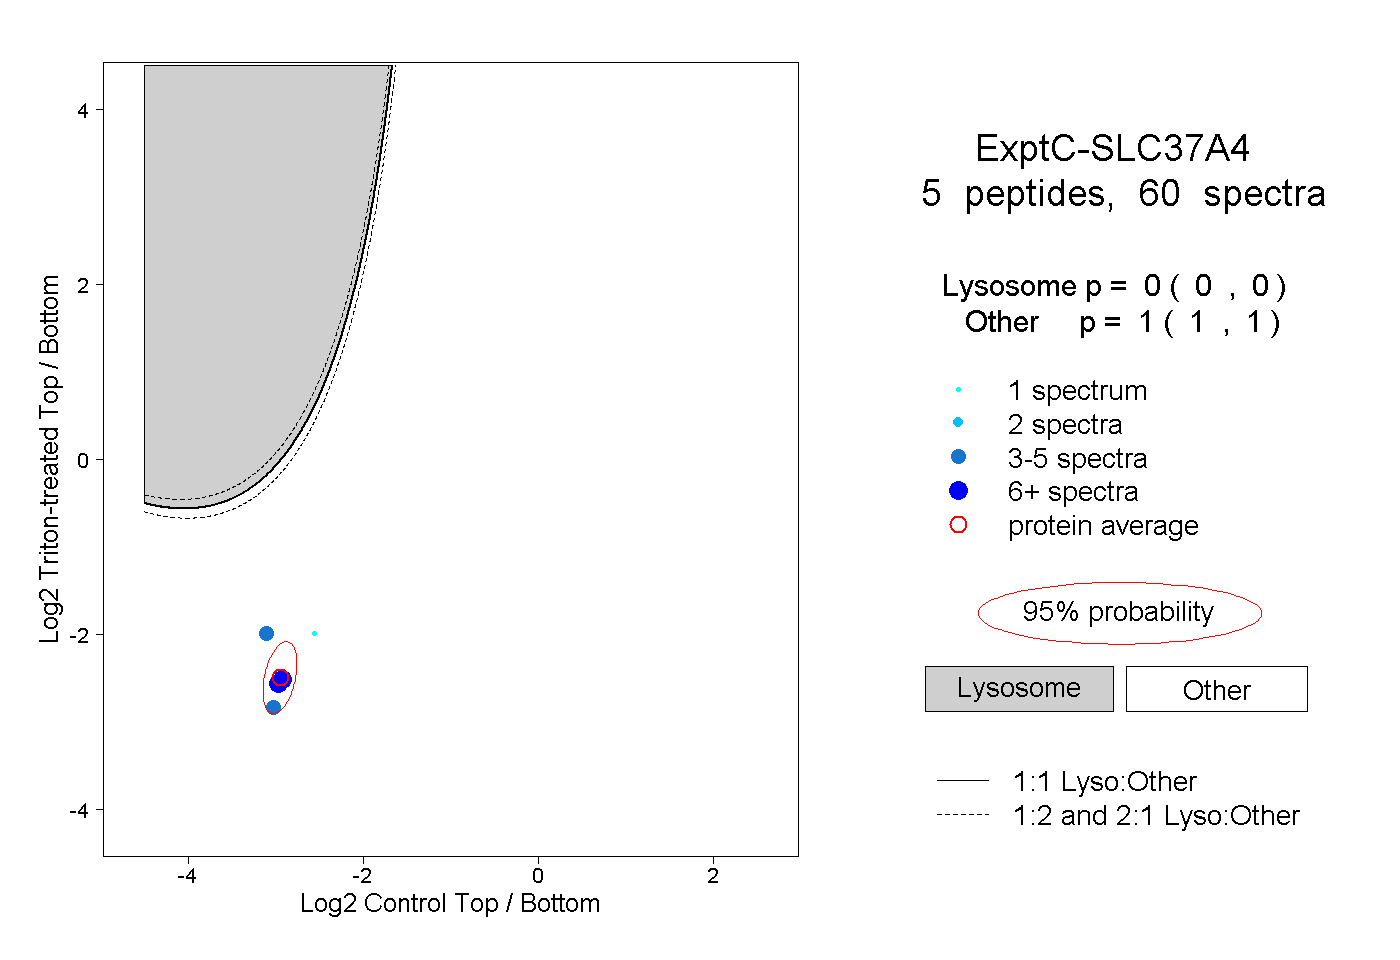
0.000 | 0.000
1.000 | 1.000
1peptide
spectrum

NA | NA
NA | NA