 2
2peptides
spectra
0.000 | 0.000
0.000 | 0.019
0.000 | 0.006
0.031 | 0.125
0.000 | 0.098
0.000 | 0.054
0.831 | 0.884
0.000 | 0.000
1peptide
spectra
0.000 | 0.000
1.000 | 1.000
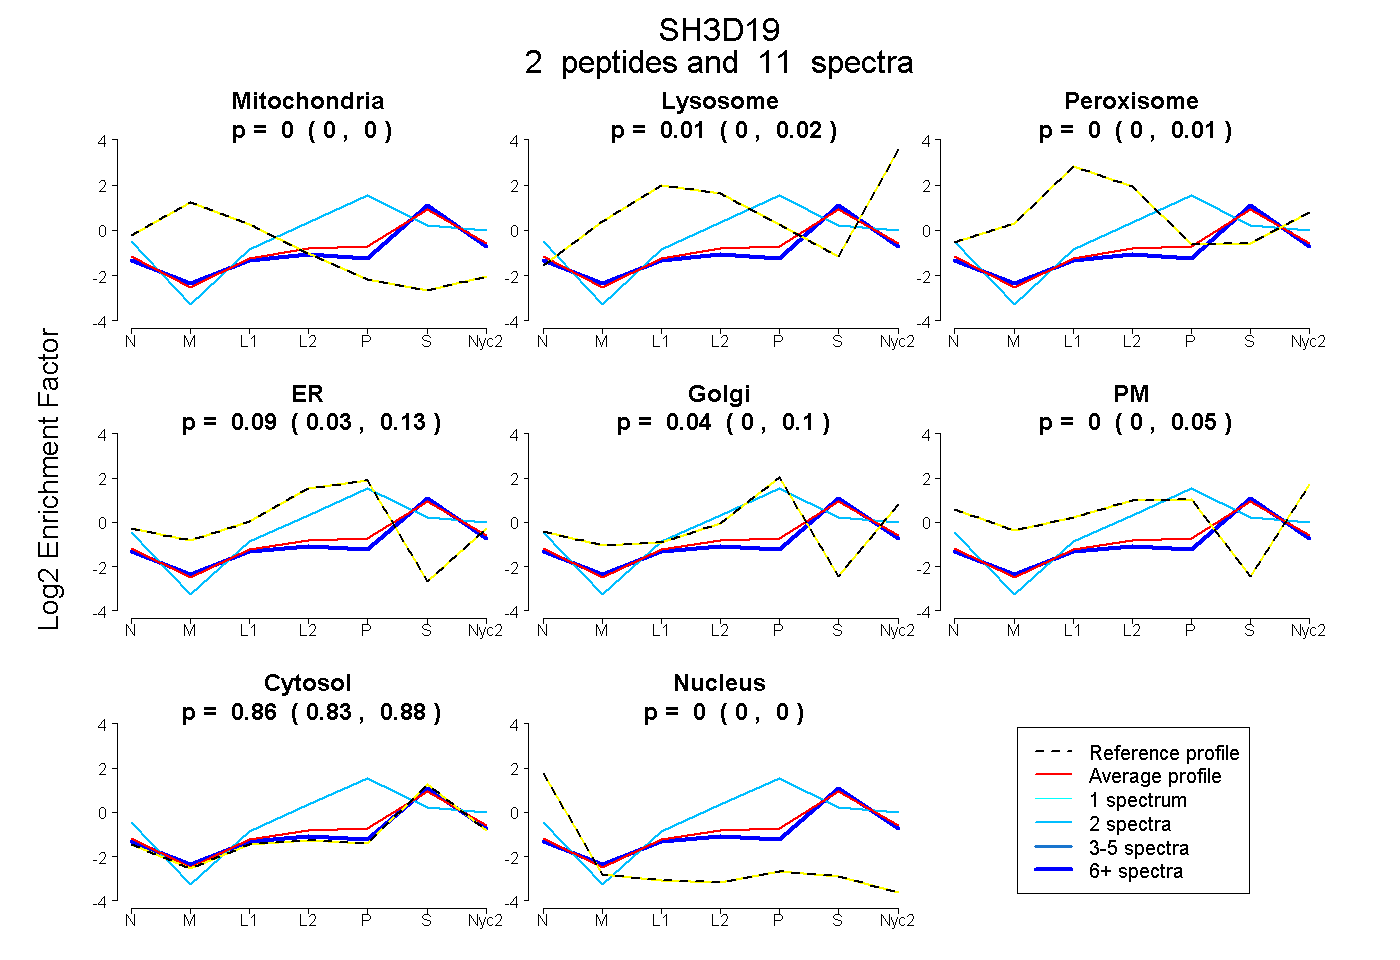
| Plot | Mito | Lyso | Perox | ER | Golgi | PM | Cytosol | Nucleus | |||||
| Expt A |
2 peptides |
11 spectra |
|
0.000 0.000 | 0.000 |
0.006 0.000 | 0.019 |
0.000 0.000 | 0.006 |
0.095 0.031 | 0.125 |
0.041 0.000 | 0.098 |
0.000 0.000 | 0.054 |
0.859 0.831 | 0.884 |
0.000 0.000 | 0.000 |
||
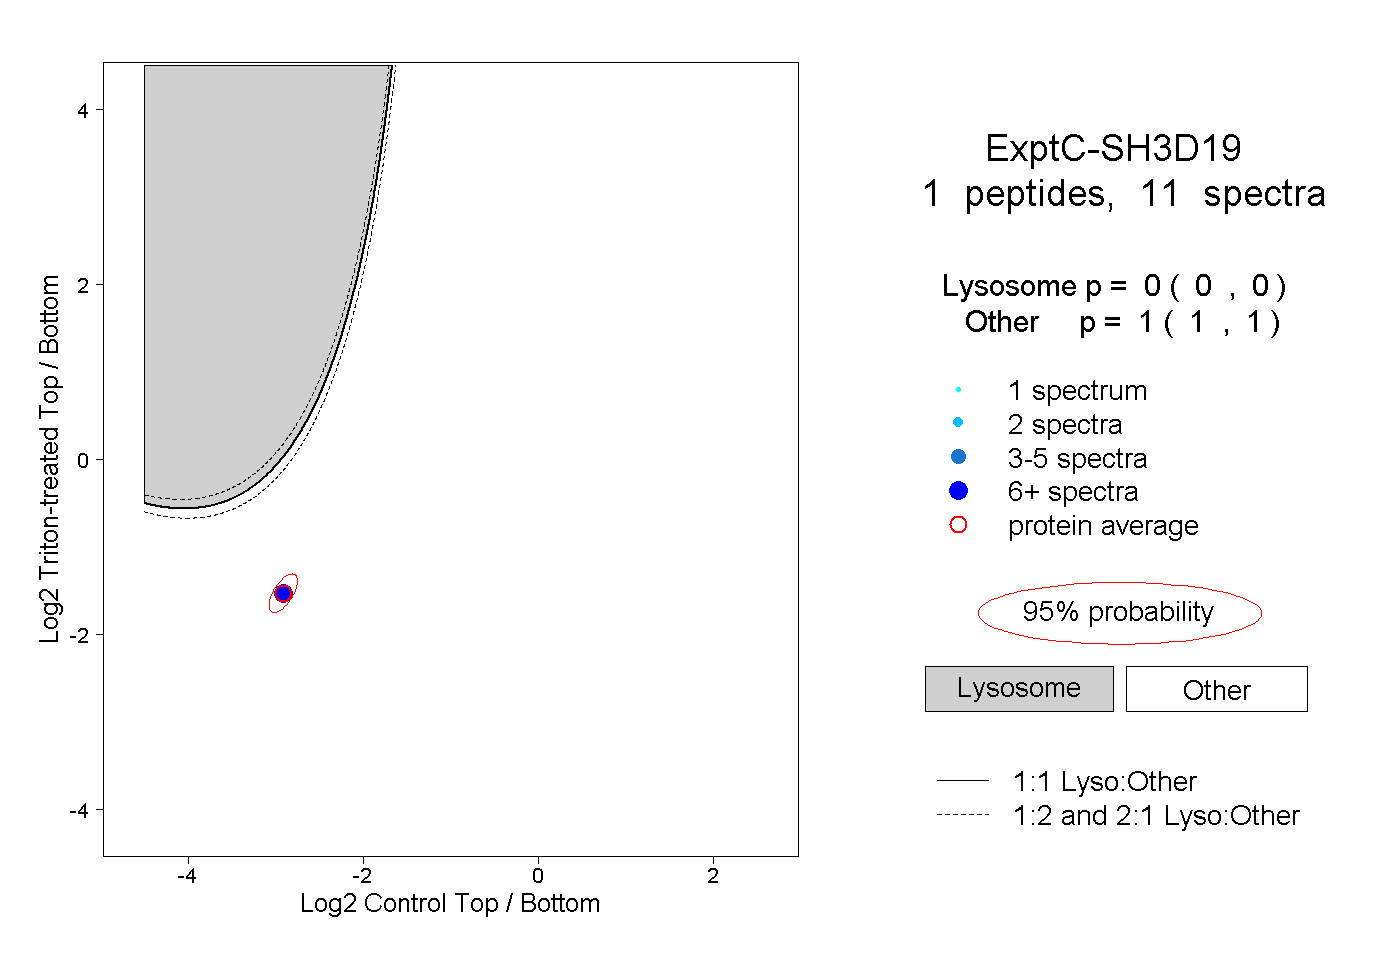
| Plot | Lyso | Other | |||||||||||
| Expt C |
1 peptide |
11 spectra |
|
0.000 0.000 | 0.000 |
1.000 1.000 | 1.000 |