 3
3peptides
spectra
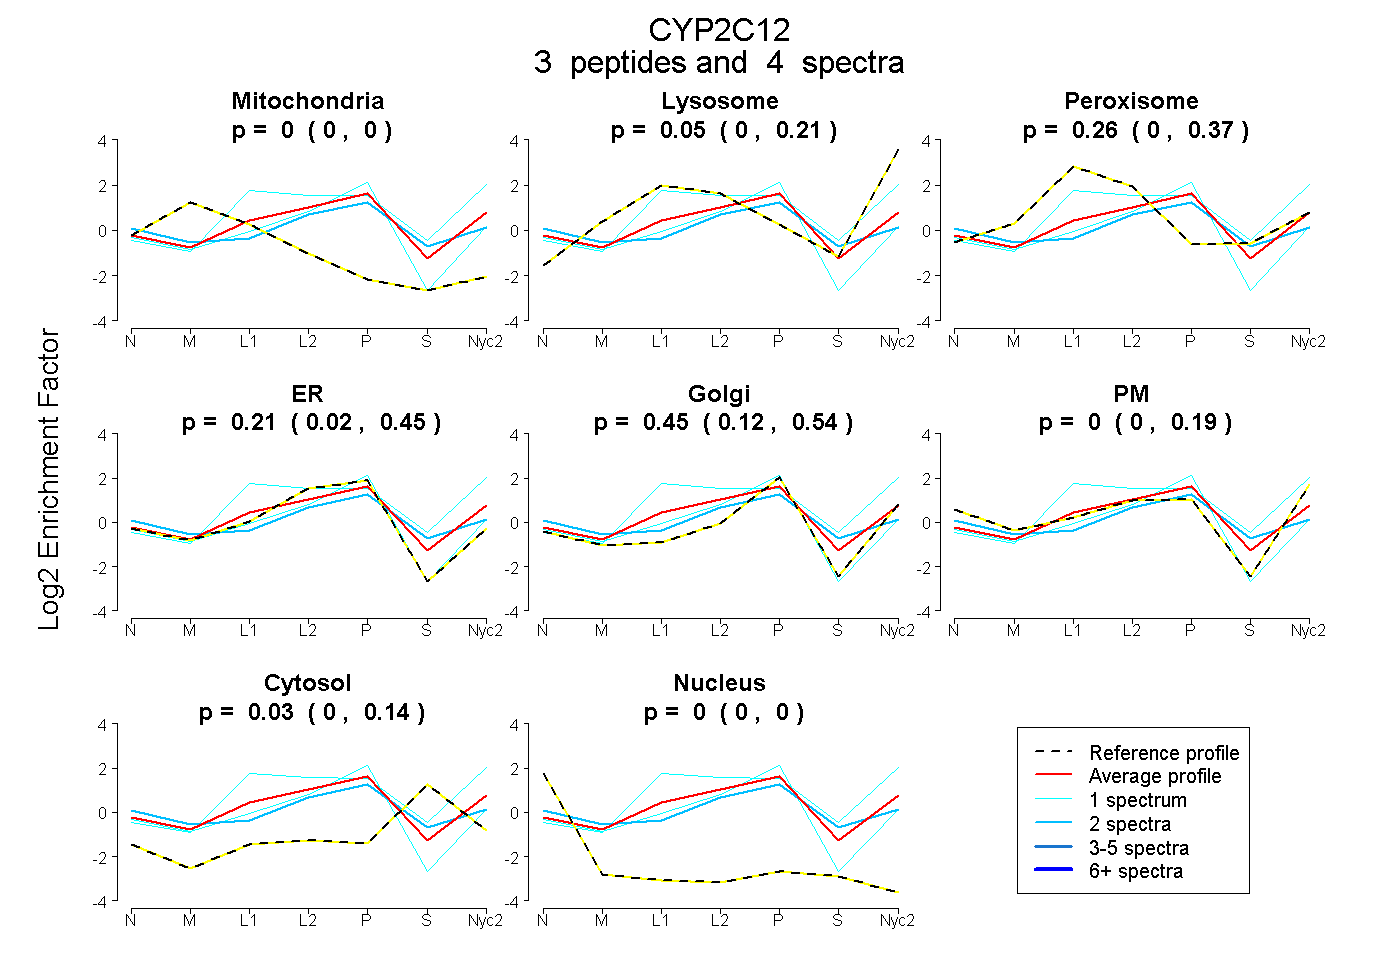
0.000 | 0.000
0.000 | 0.207
0.000 | 0.369
0.021 | 0.455
0.115 | 0.542
0.000 | 0.194
0.000 | 0.141
0.000 | 0.000
1peptide
spectrum
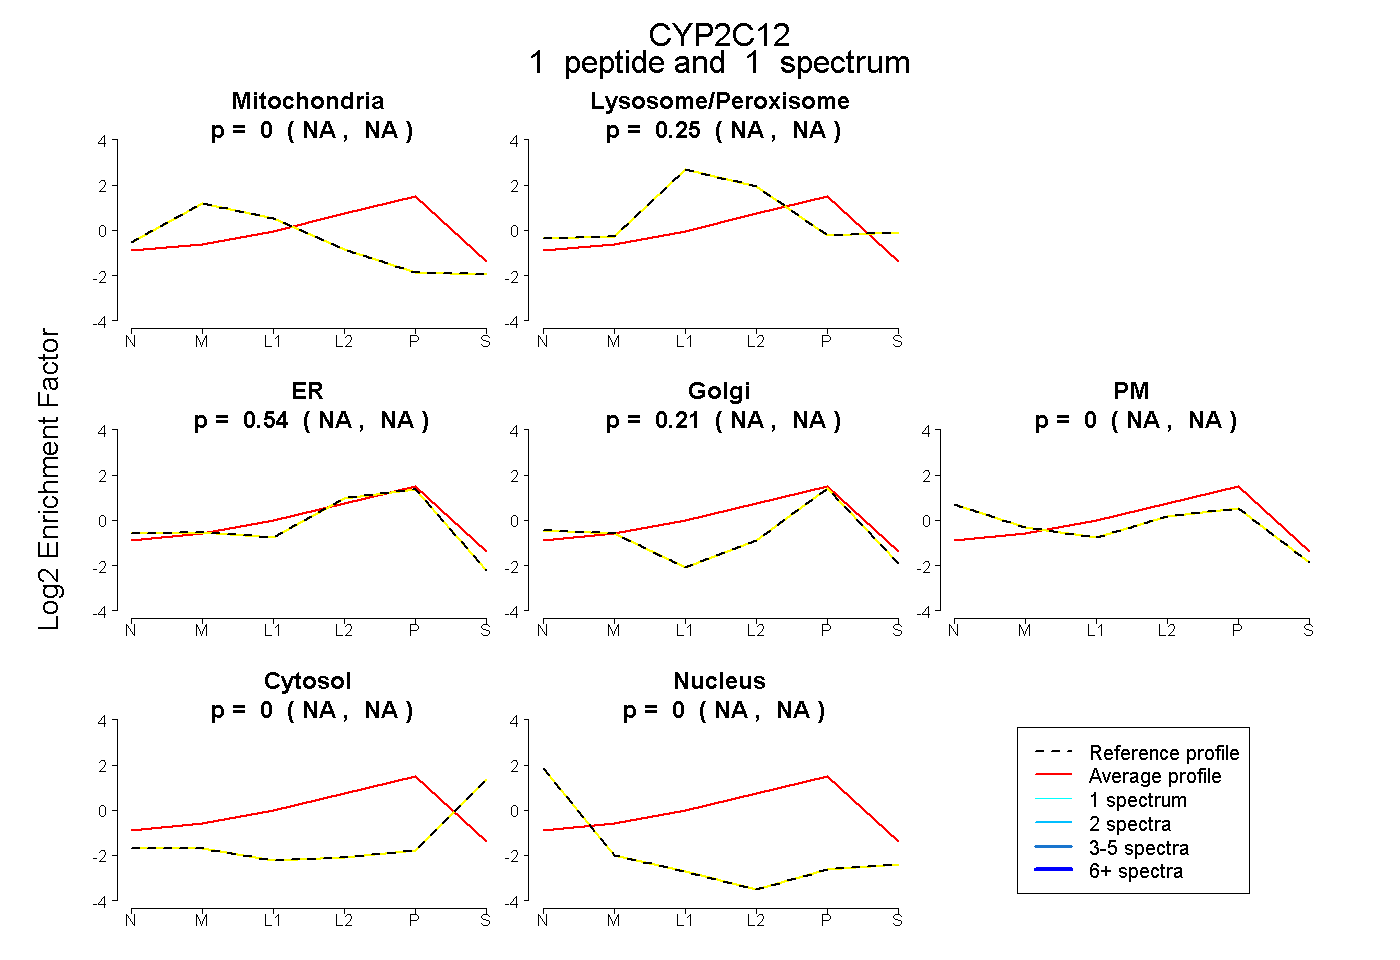
NA | NA
NA | NA
NA | NA
NA | NA
NA | NA
NA | NA
NA | NA
12peptides
spectra
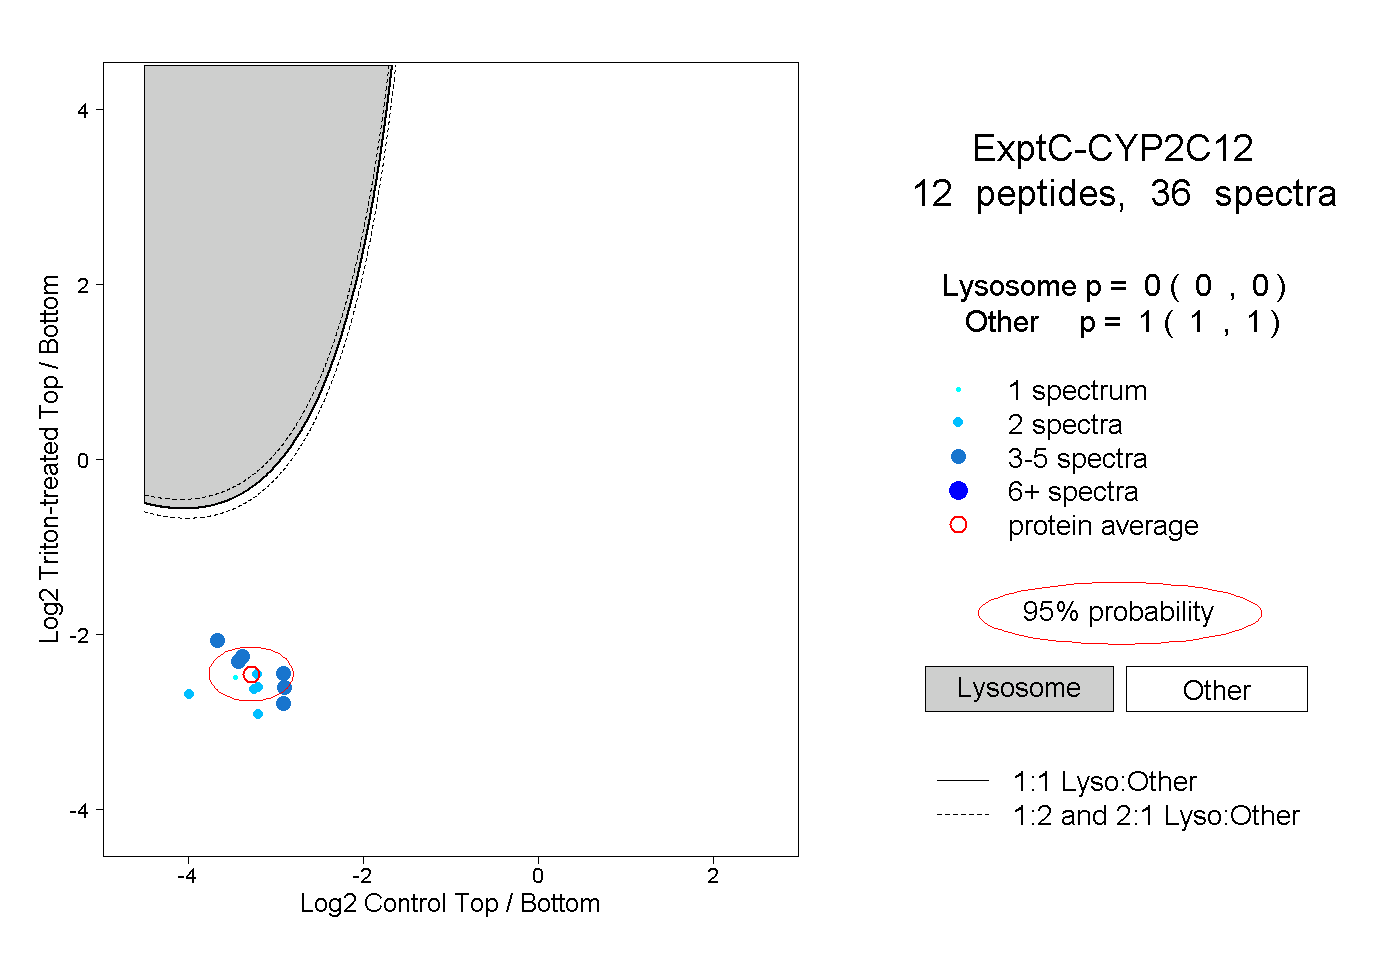
0.000 | 0.000
1.000 | 1.000
4peptides
spectra
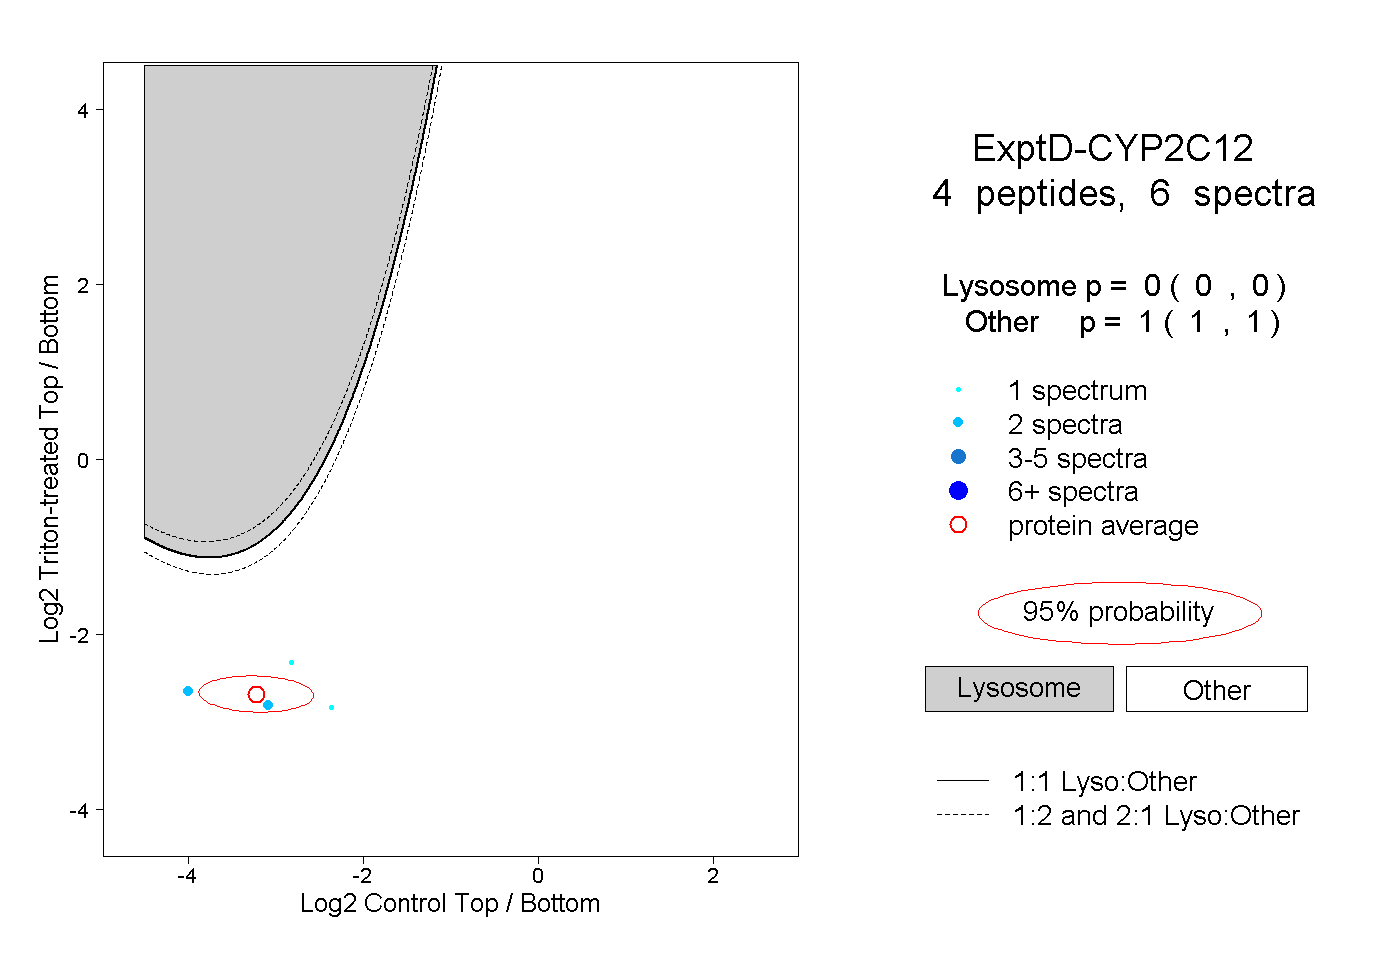
0.000 | 0.000
1.000 | 1.000