 11
11peptides
spectra
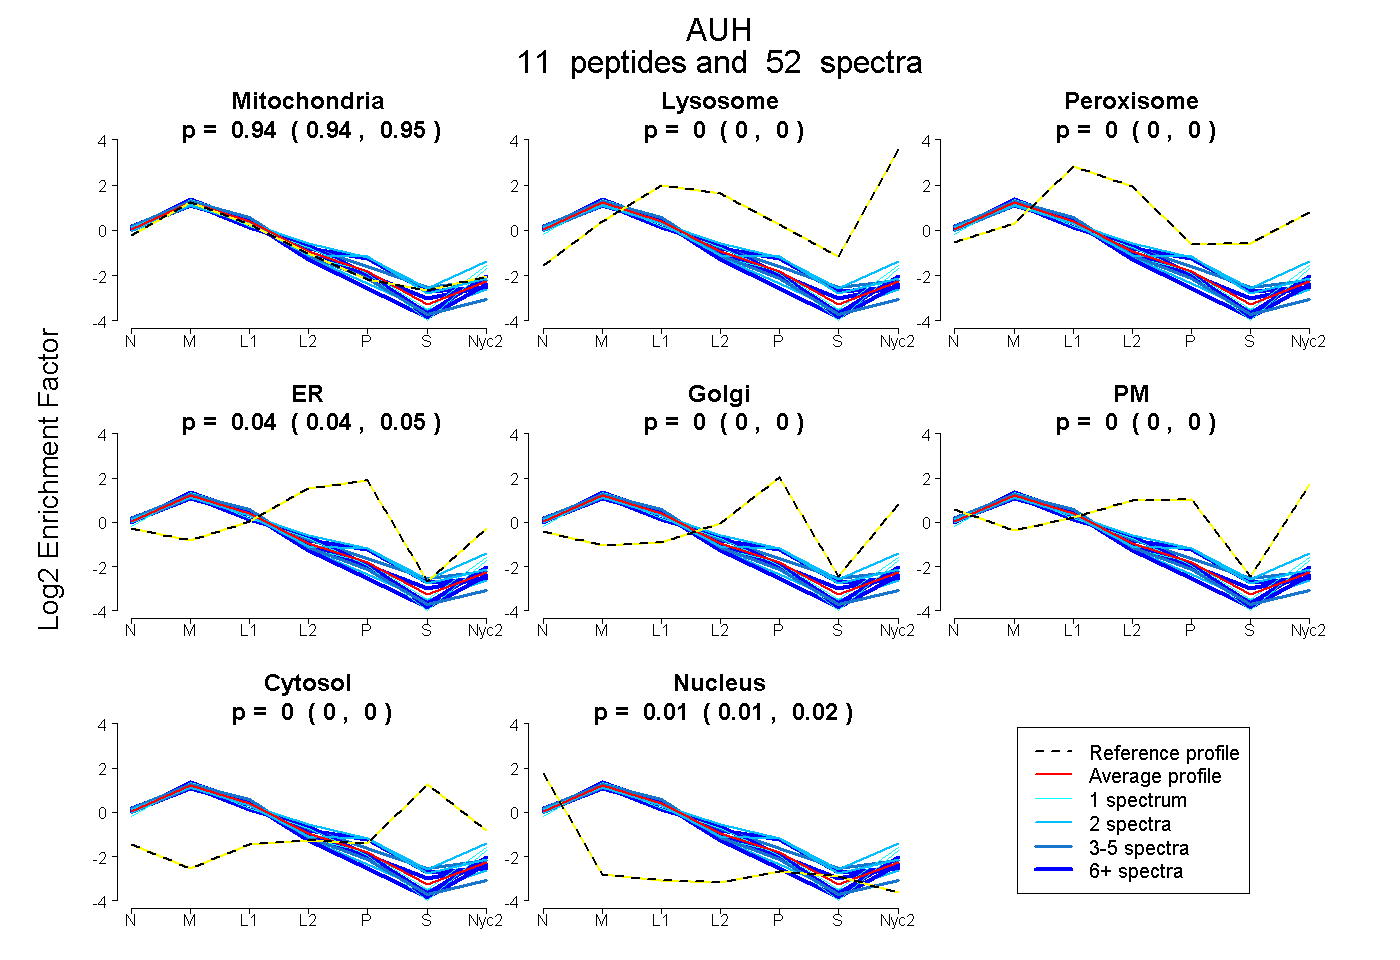
0.938 | 0.949
0.000 | 0.000
0.000 | 0.000
0.036 | 0.047
0.000 | 0.000
0.000 | 0.000
0.000 | 0.000
0.012 | 0.016
12peptides
spectra
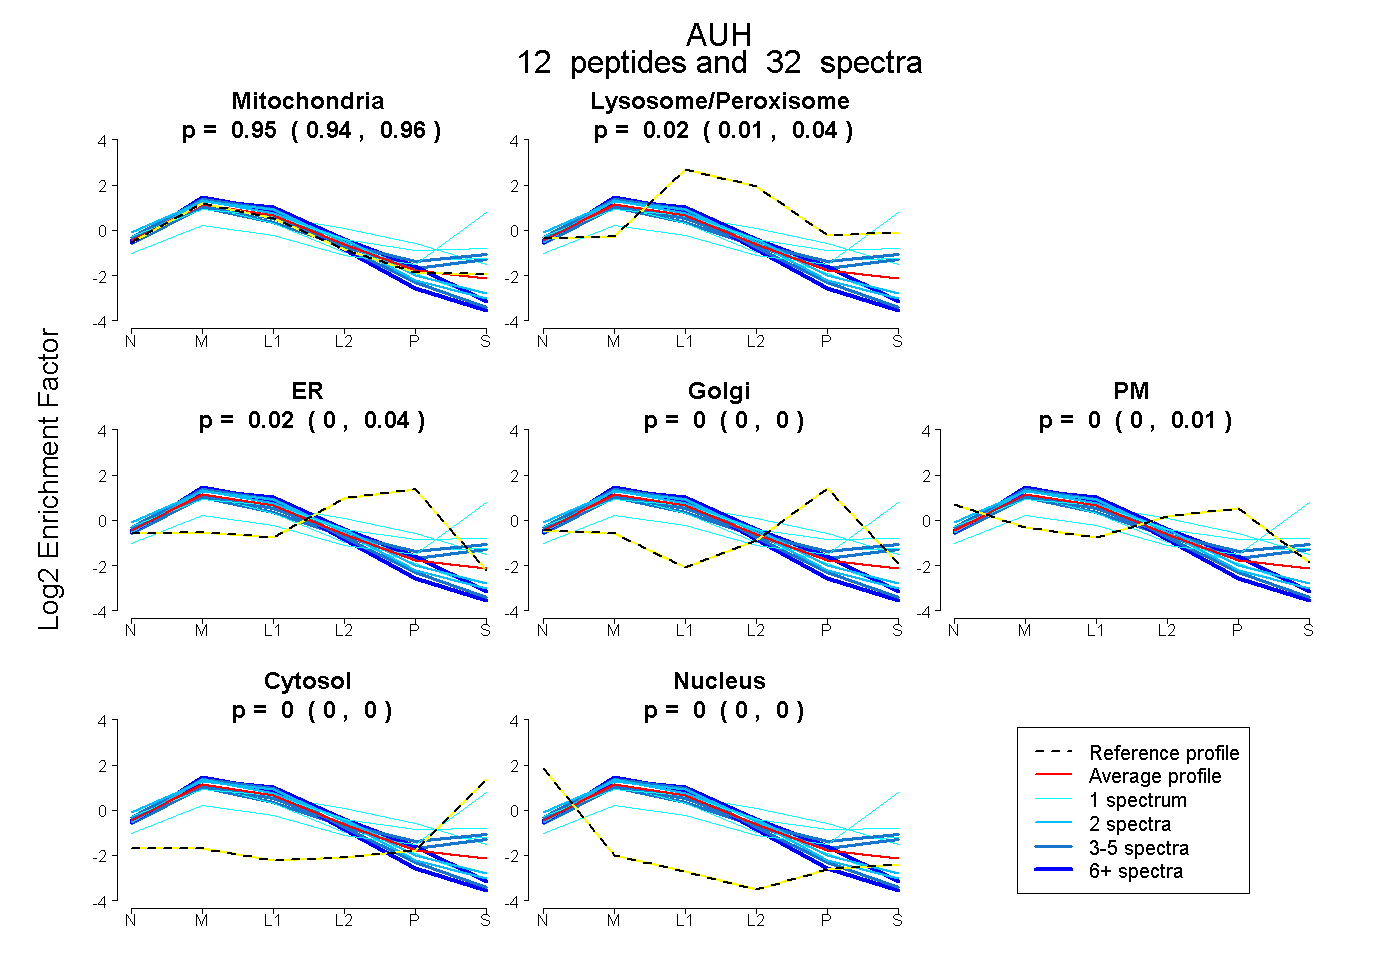
0.937 | 0.963
0.006 | 0.038
0.000 | 0.038
0.000 | 0.000
0.000 | 0.013
0.000 | 0.000
0.000 | 0.000
15peptides
spectra
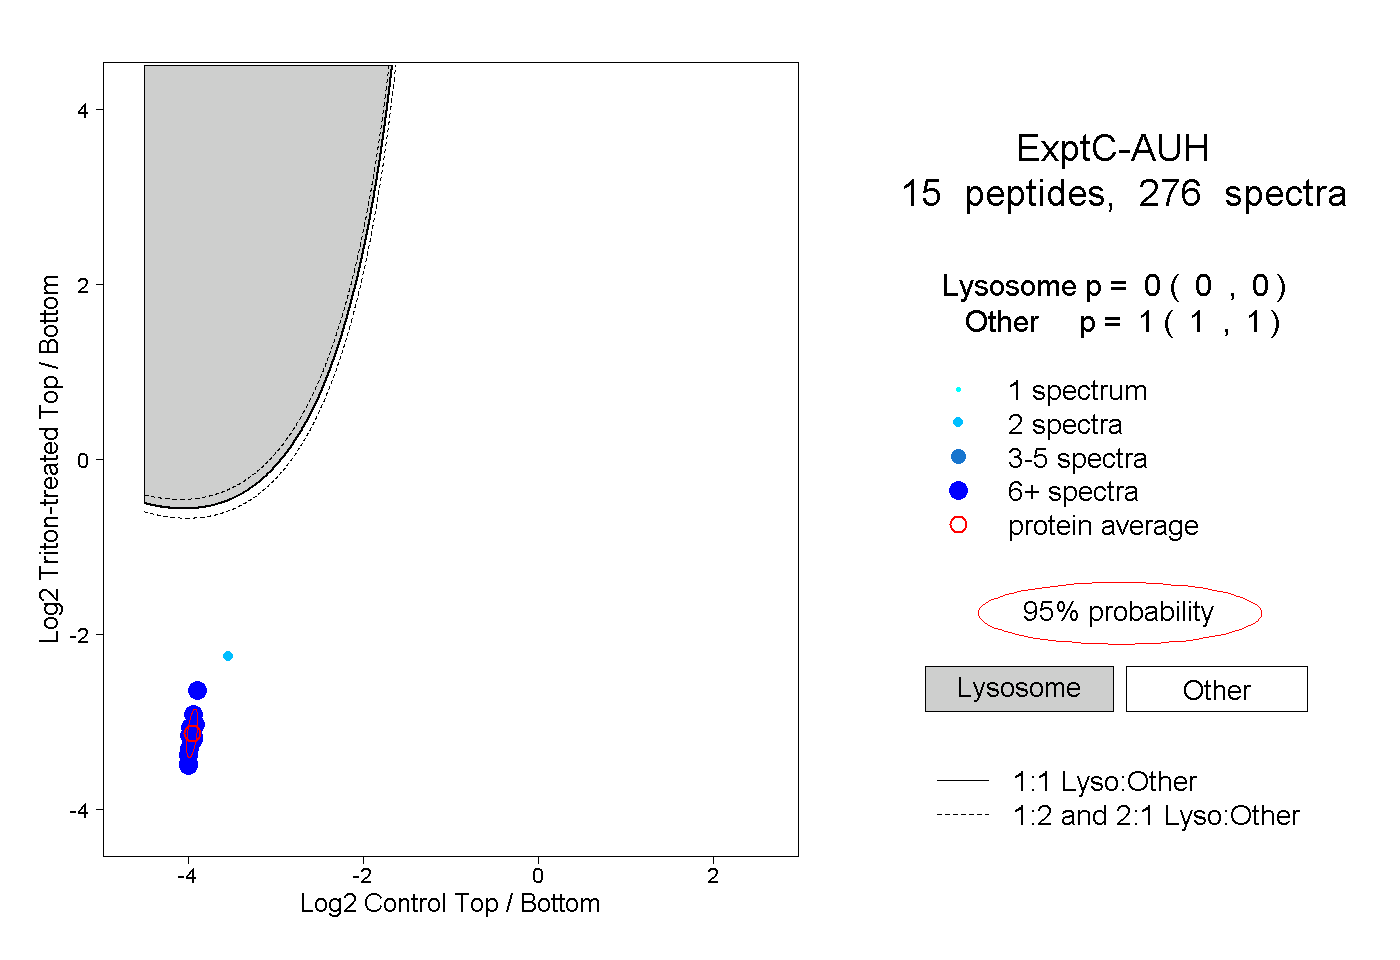
0.000 | 0.000
1.000 | 1.000
8peptides
spectra
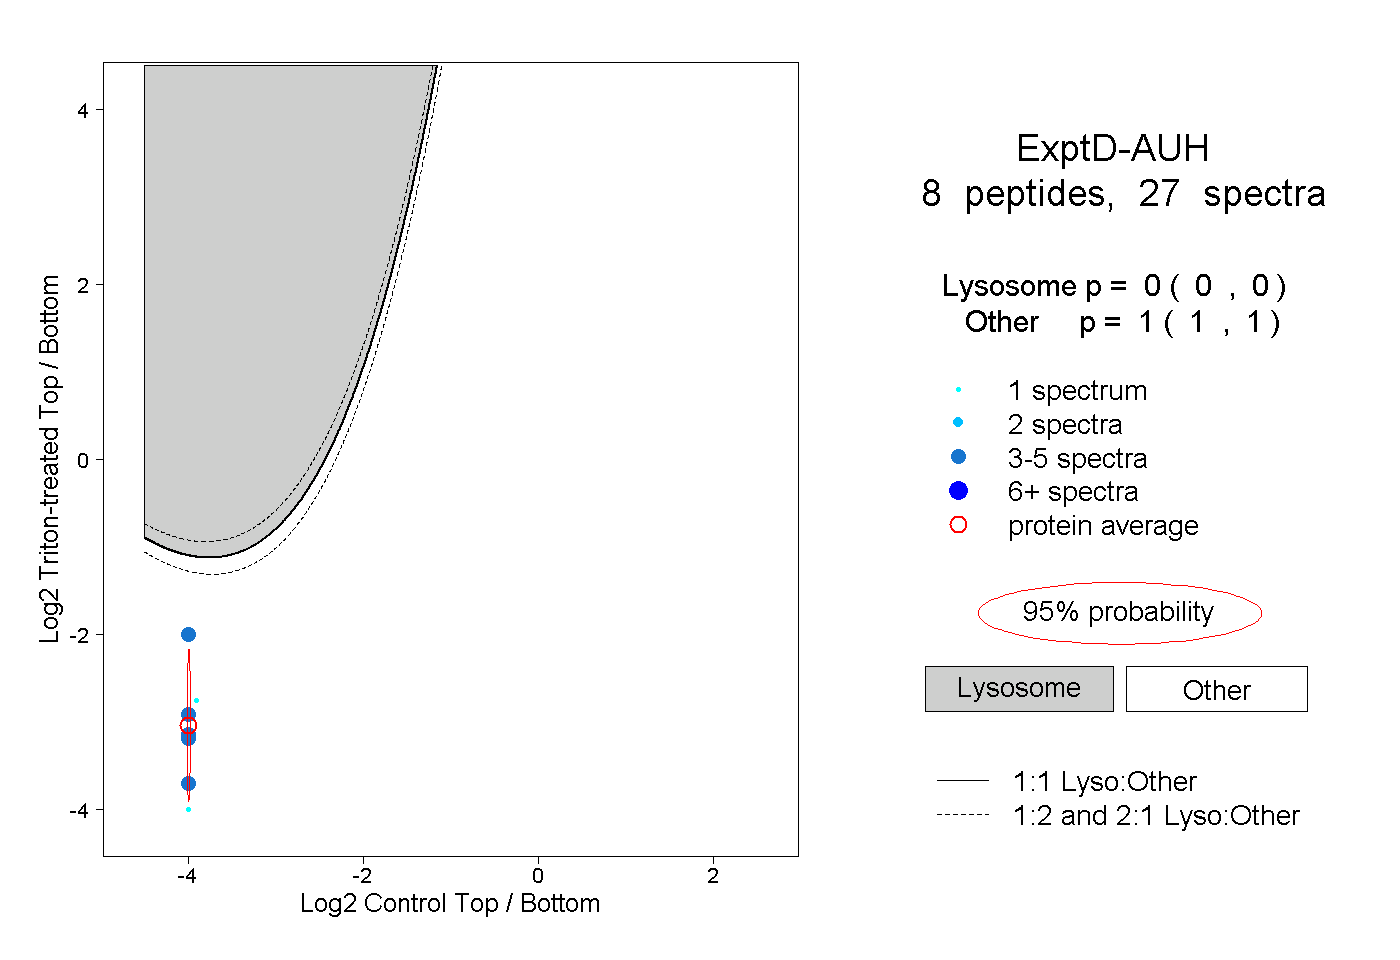
0.000 | 0.000
1.000 | 1.000