 4
4peptides
spectra
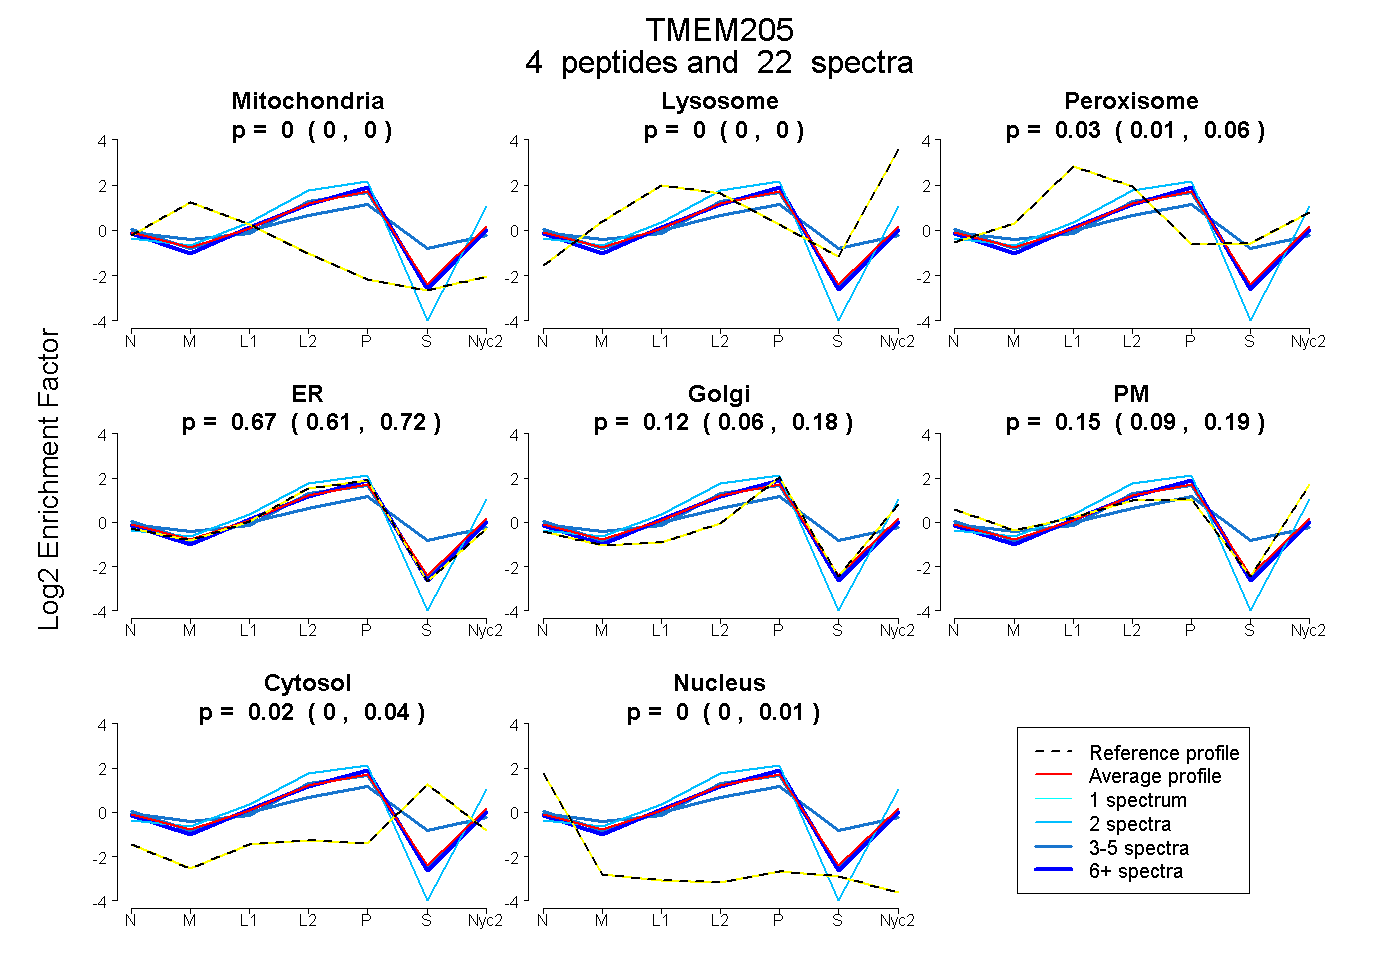
0.000 | 0.002
0.000 | 0.000
0.006 | 0.062
0.612 | 0.716
0.059 | 0.183
0.095 | 0.191
0.000 | 0.039
0.000 | 0.014
4peptides
spectra
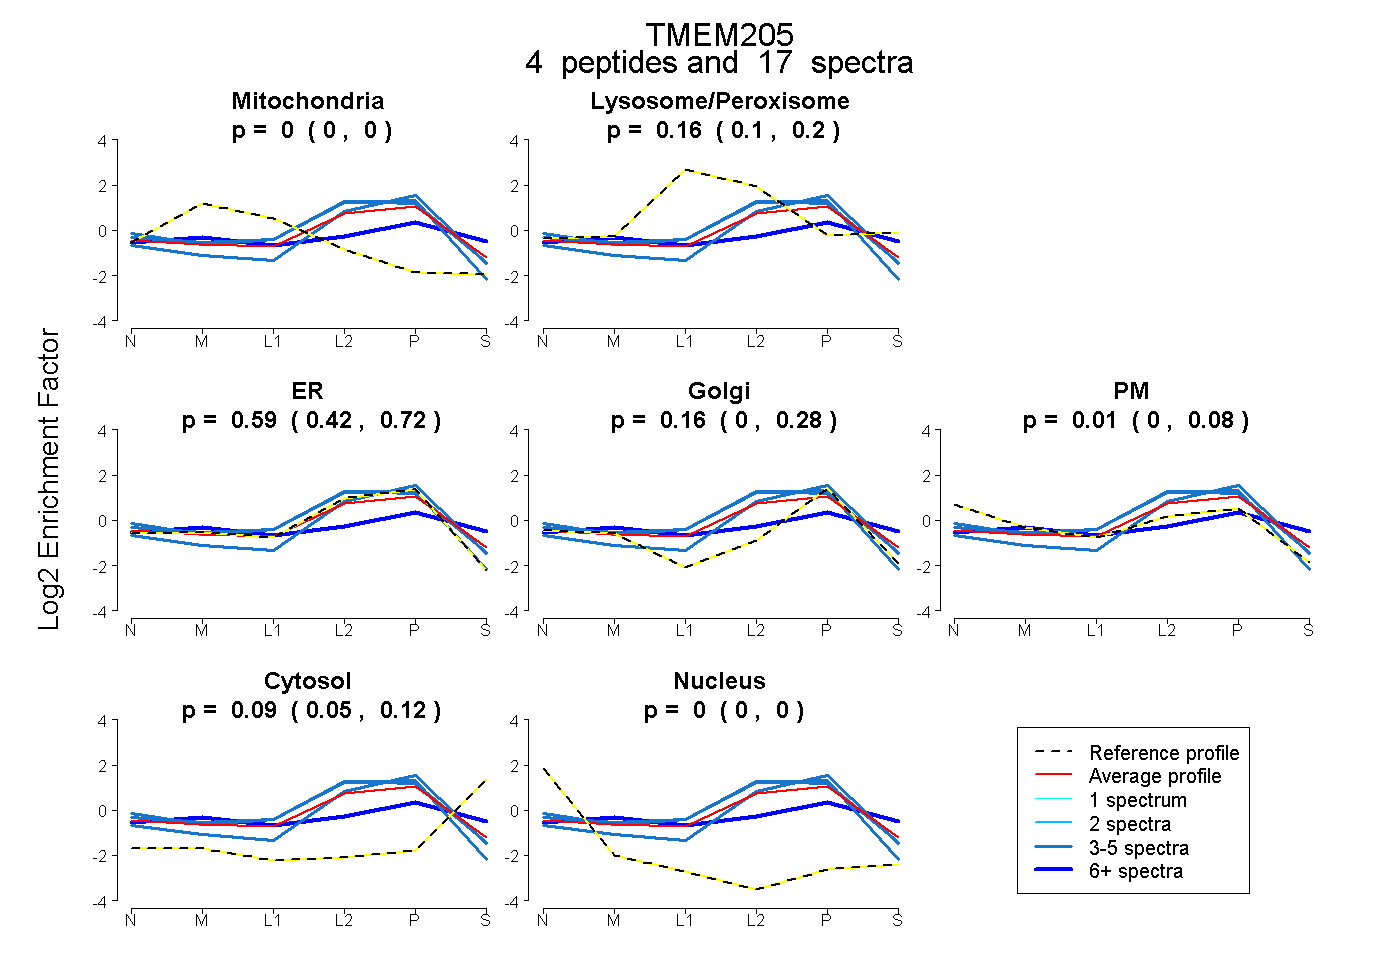
0.000 | 0.000
0.100 | 0.200
0.422 | 0.716
0.000 | 0.278
0.000 | 0.076
0.050 | 0.119
0.000 | 0.000
4peptides
spectra
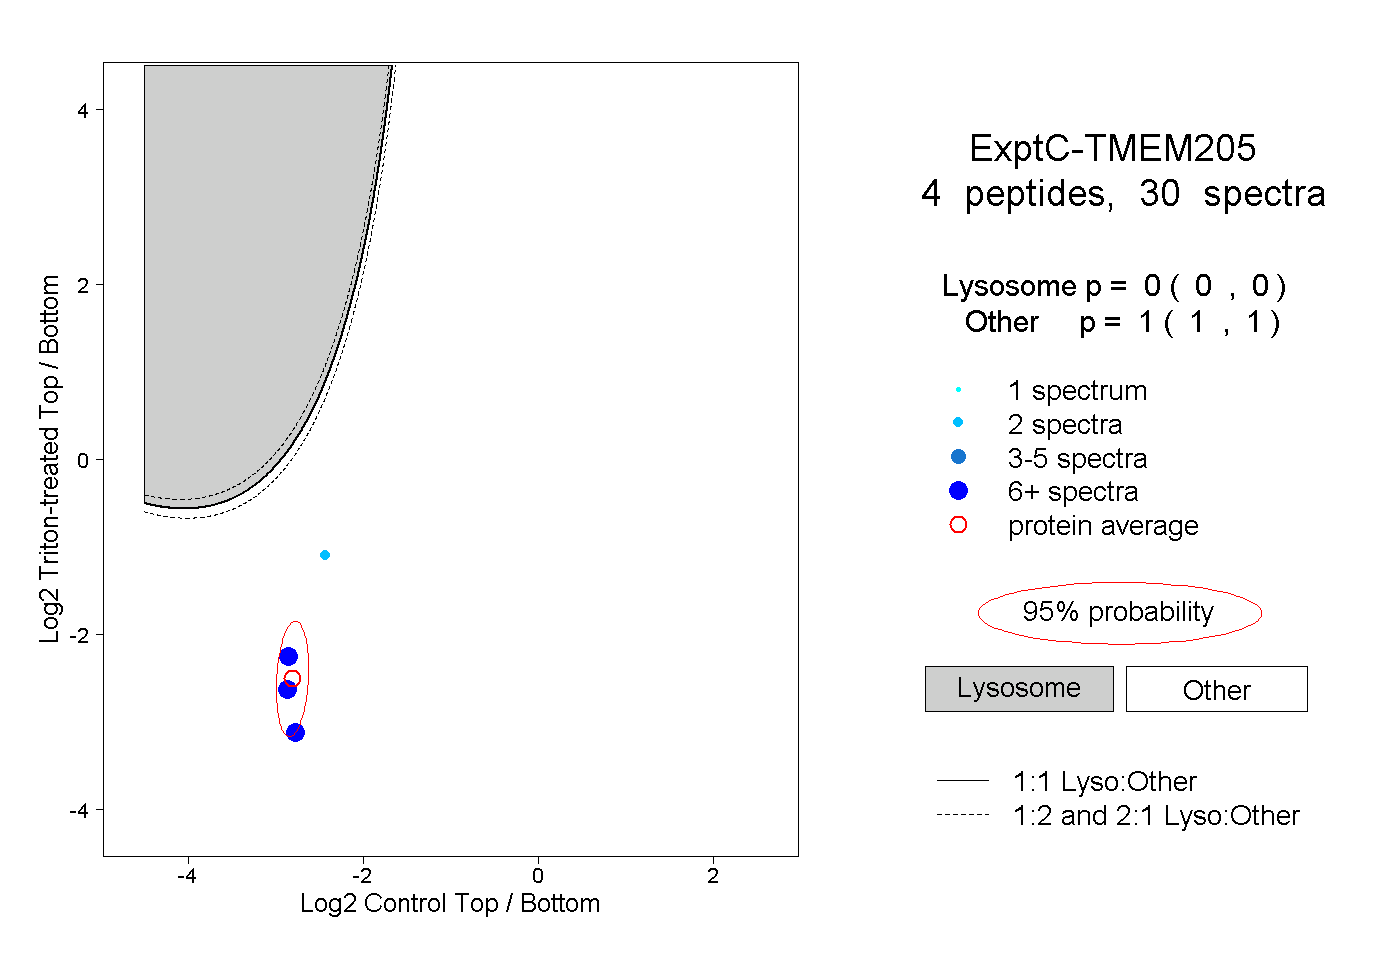
0.000 | 0.000
1.000 | 1.000
3peptides
spectra
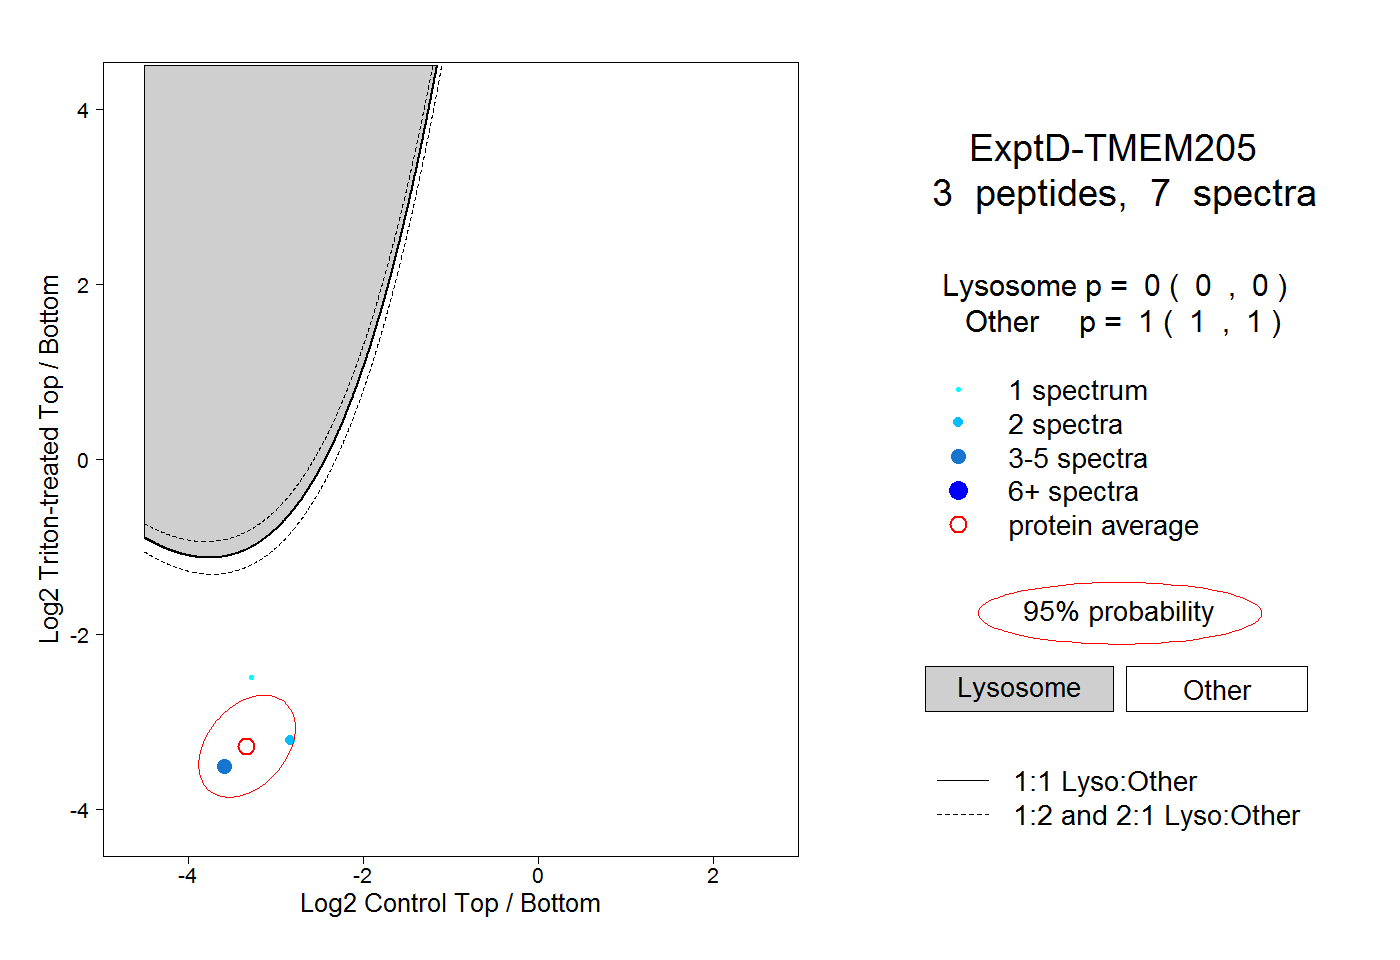
0.000 | 0.000
1.000 | 1.000