RPUSD4
[ENSRNOP00000015670]
Main page
| | | Plot |
Mito |
Lyso |
|
Perox |
ER |
Golgi |
PM |
Cytosol |
Nucleus |
|
| Expt A |
 4
4
peptides |
9
spectra |
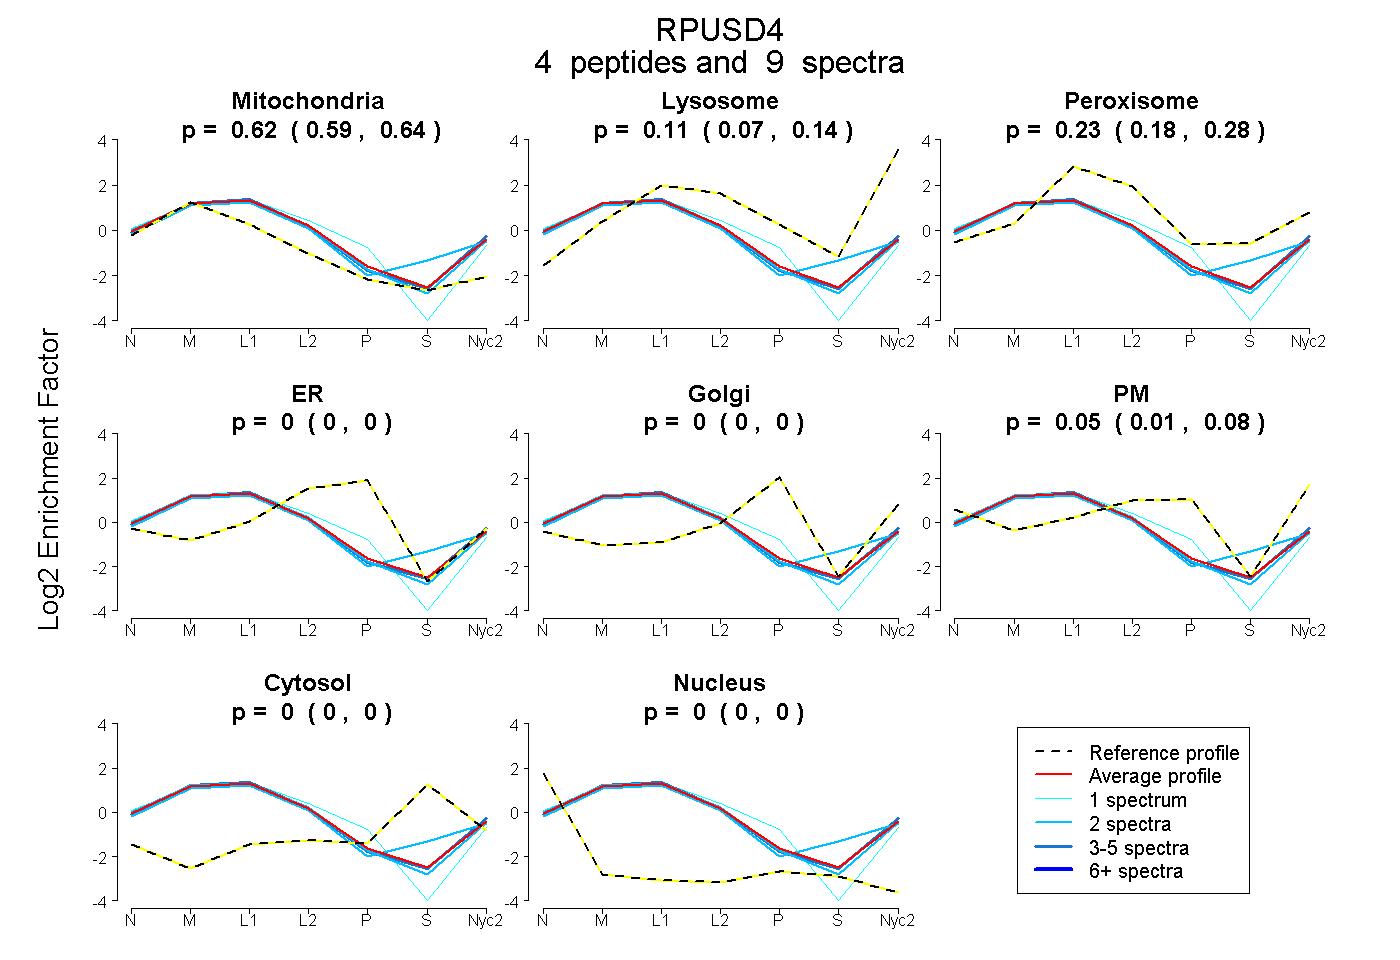 |
0.615
0.591 | 0.635 |
0.105
0.068 | 0.136 |
|
0.229
0.177 | 0.275 |
0.000
0.000 | 0.000 |
0.000
0.000 | 0.000 |
0.050
0.012 | 0.083 |
0.000
0.000 | 0.000 |
0.000
0.000 | 0.000 |
|
| | | Plot |
Mito |
|
Lyso or Perox |
|
ER |
Golgi |
PM |
Cytosol |
Nucleus |
|
| Expt B |
2
peptides |
4
spectra |
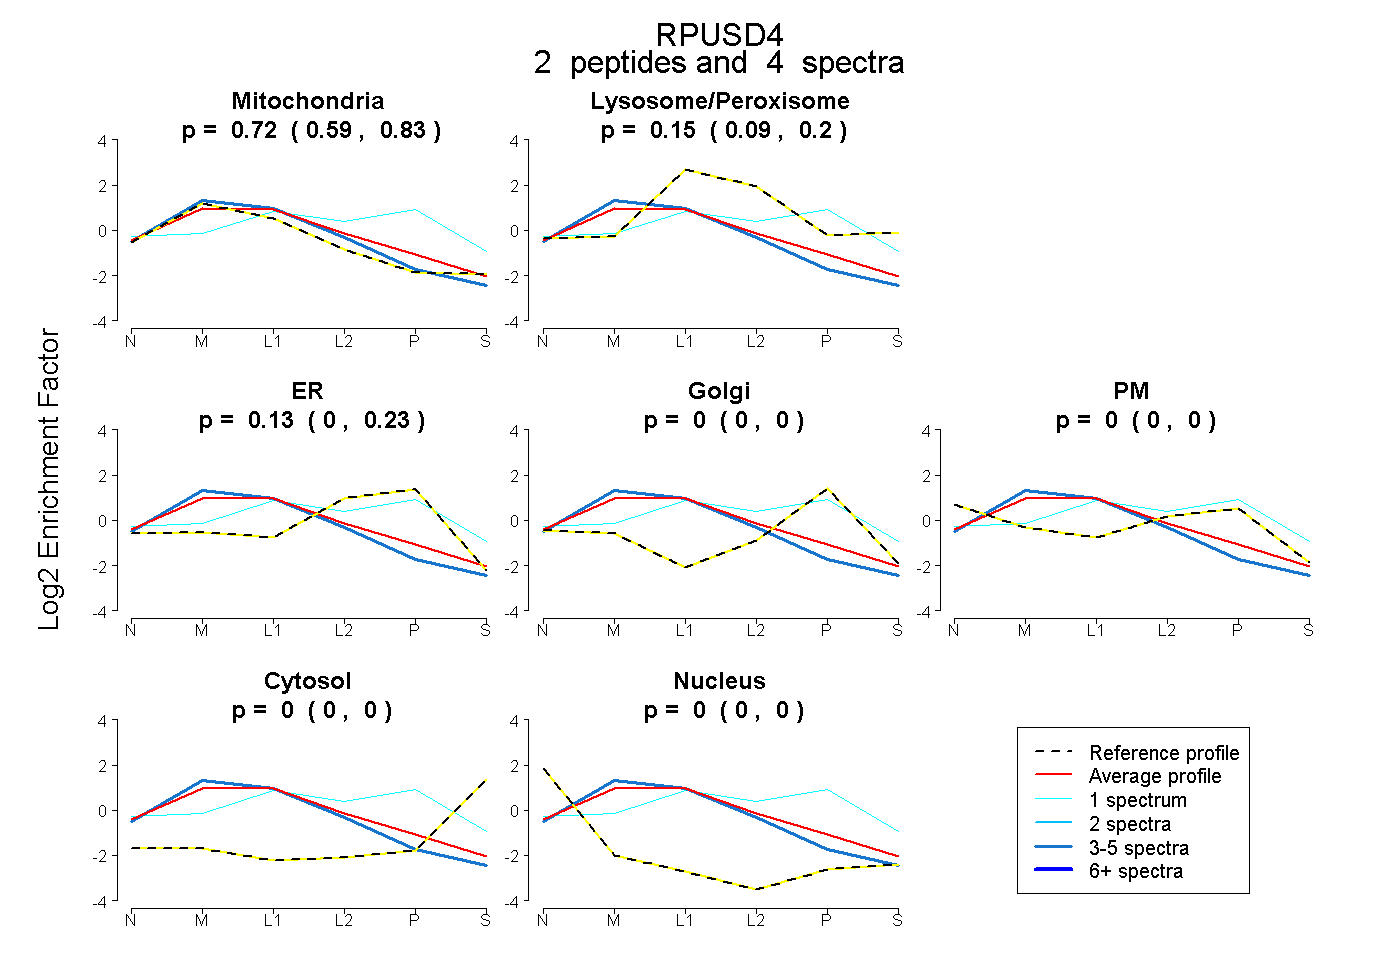 |
0.722
0.592 | 0.828 |
|
0.150
0.095 | 0.198 |
|
0.127
0.002 | 0.227 |
0.000
0.000 | 0.000 |
0.000
0.000 | 0.000 |
0.000
0.000 | 0.000 |
0.000
0.000 | 0.000 |
|
| | | Plot |
|
Lyso |
|
|
|
|
|
|
|
Other |
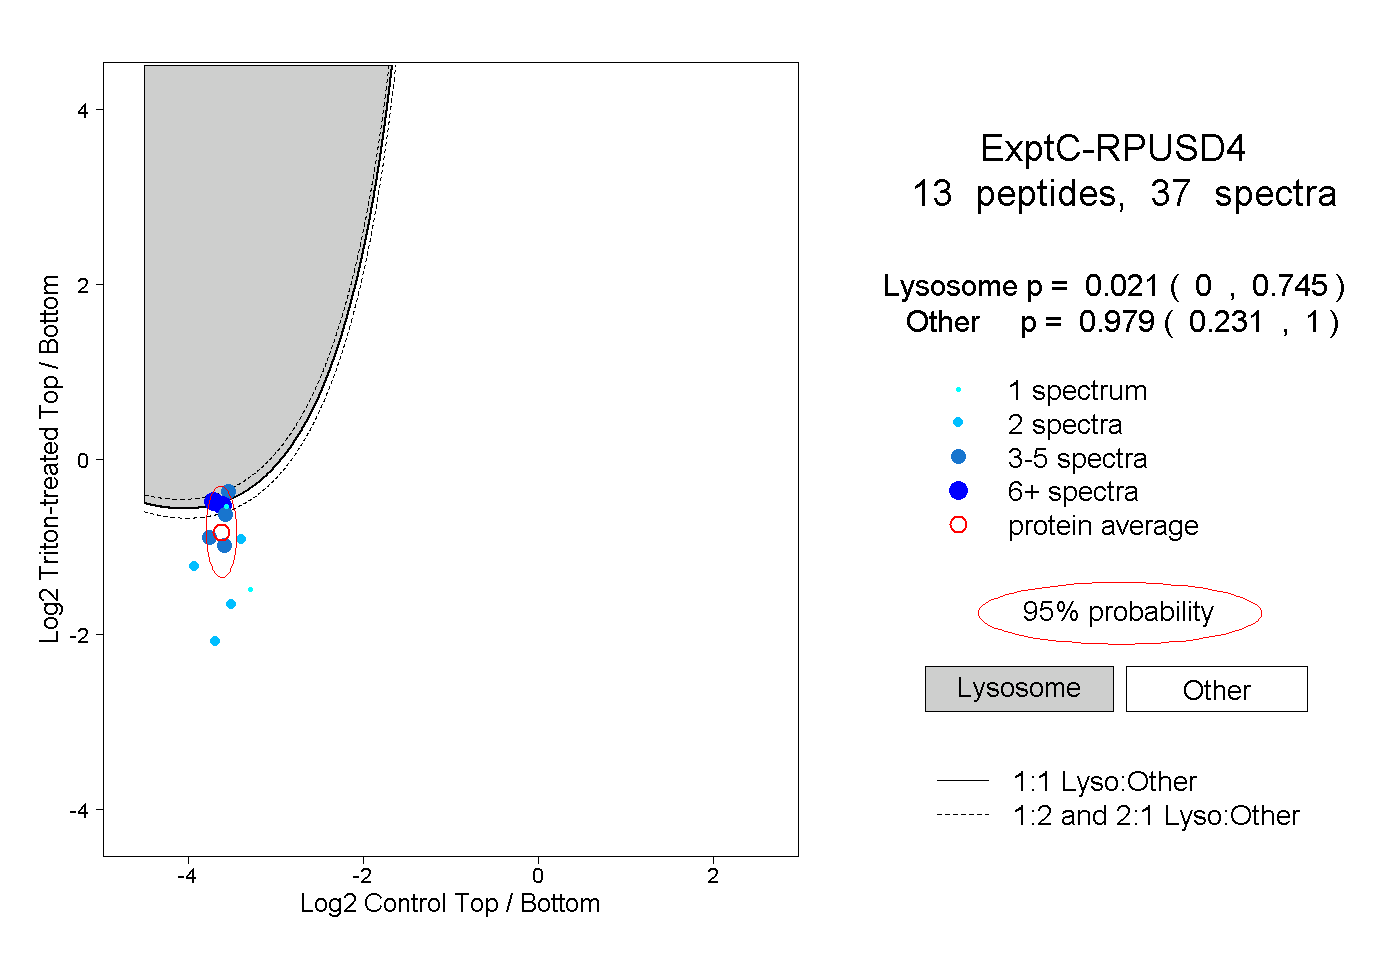
| Expt C |
13
peptides |
37
spectra |
 |
|
0.021
0.000 | 0.745 |
|
|
|
|
|
|
|
0.979
0.231 | 1.000 |
| 4 spectra, QLILPALGSR |
|
0.150 |
|
|
|
|
|
|
|
0.850 |
| 2 spectra, LSAGTLK |
|
0.003 |
|
|
|
|
|
|
|
0.997 |
| 2 spectra, YSDWNR |
|
0.000 |
|
|
|
|
|
|
|
1.000 |
| 1 spectrum, VQELVR |
|
0.337 |
|
|
|
|
|
|
|
0.663 |
| 3 spectra, LGLDMPNEDQSR |
|
0.765 |
|
|
|
|
|
|
|
0.235 |
| 6 spectra, ATSSRPLNAQR |
|
0.628 |
|
|
|
|
|
|
|
0.372 |
| 3 spectra, LGLQQSK |
|
0.014 |
|
|
|
|
|
|
|
0.986 |
| 4 spectra, VPTNPVQR |
|
0.003 |
|
|
|
|
|
|
|
0.997 |
| 1 spectrum, MTLRPSYR |
|
0.000 |
|
|
|
|
|
|
|
1.000 |
| 6 spectra, LPHFFAR |
|
0.410 |
|
|
|
|
|
|
|
0.590 |
| 2 spectra, DMAHQVQELFR |
|
0.000 |
|
|
|
|
|
|
|
1.000 |
| 1 spectrum, FTQQLQR |
|
0.104 |
|
|
|
|
|
|
|
0.896 |
| 2 spectra, VHPNVLAK |
|
0.000 |
|
|
|
|
|
|
|
1.000 |
| | | Plot |
|
Lyso |
|
|
|
|
|
|
|
Other |
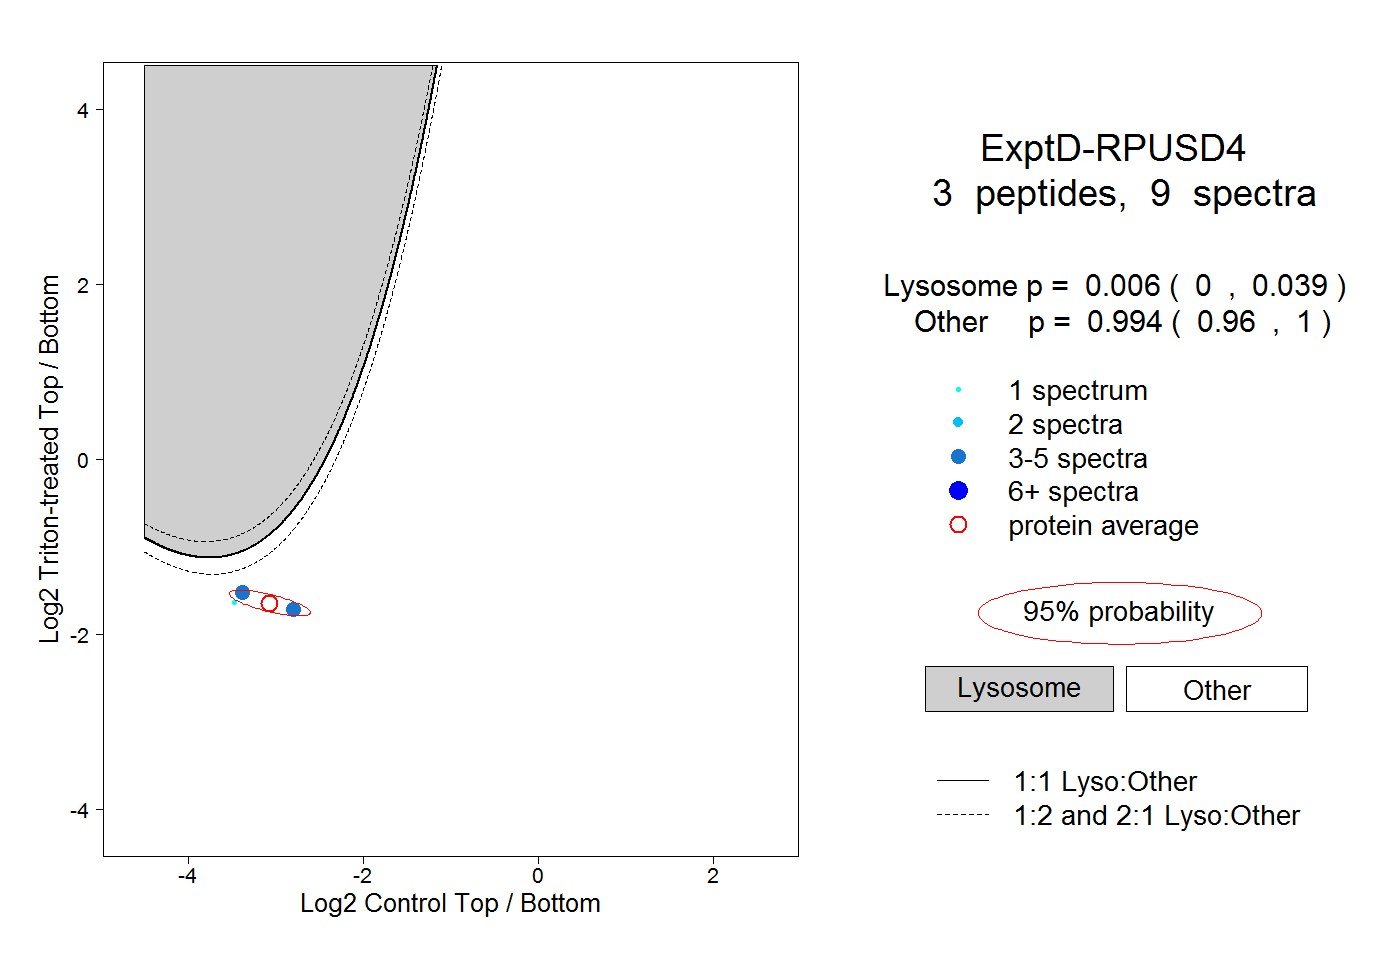
| Expt D |
3
peptides |
9
spectra |
 |
|
0.006
0.000 | 0.039 |
|
|
|
|
|
|
|
0.994
0.960 | 1.000 |