 4
4peptides
spectra
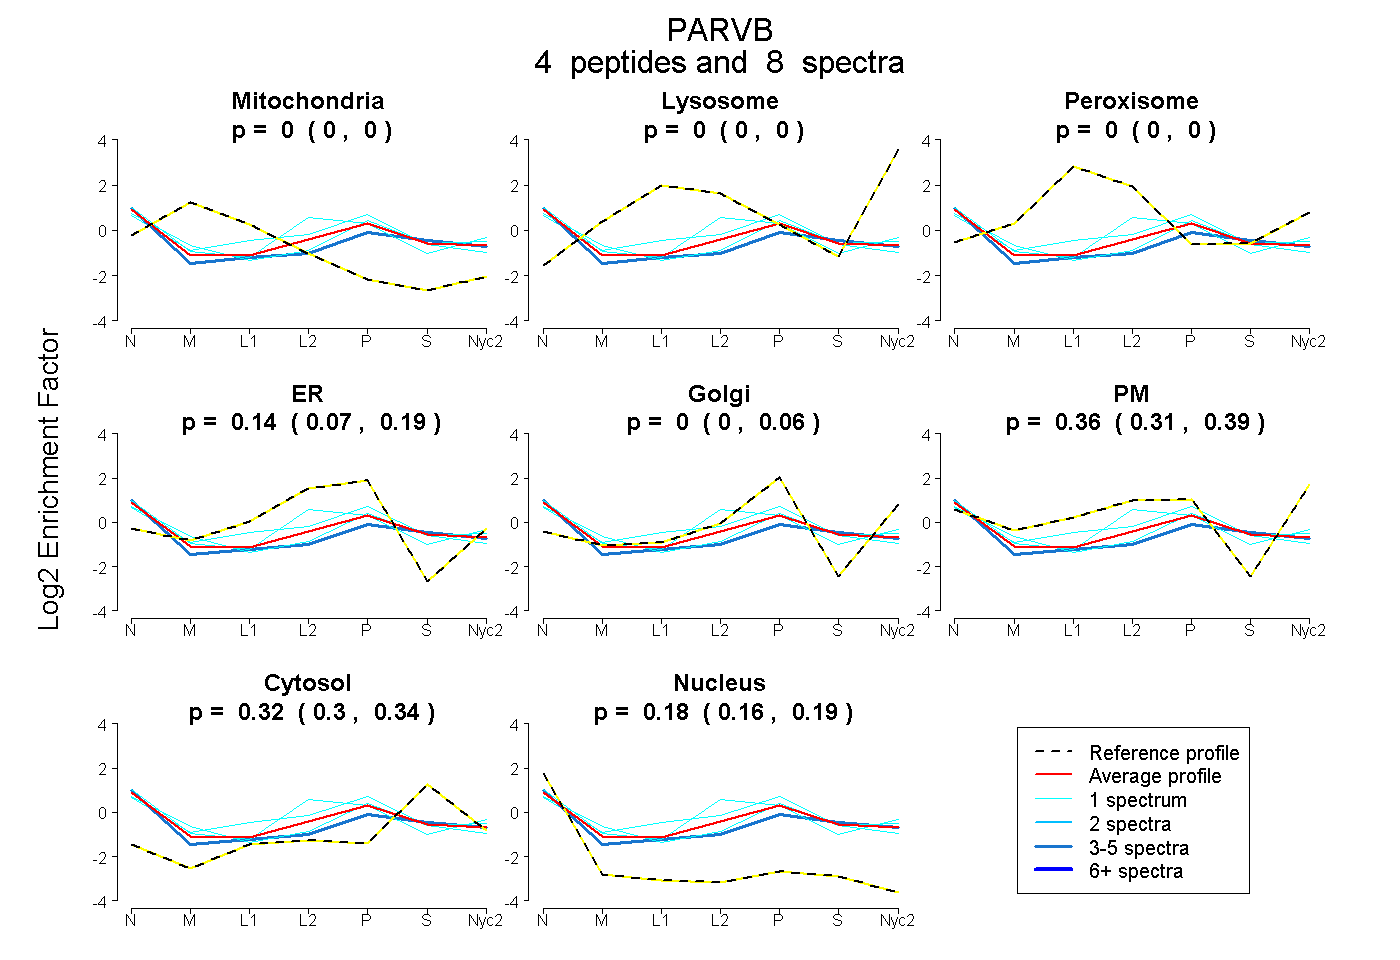
0.000 | 0.000
0.000 | 0.000
0.000 | 0.000
0.068 | 0.193
0.000 | 0.057
0.308 | 0.388
0.300 | 0.341
0.157 | 0.193
| Plot | Mito | Lyso | Perox | ER | Golgi | PM | Cytosol | Nucleus | |||||
| Expt A |
4 peptides |
8 spectra |
|
0.000 0.000 | 0.000 |
0.000 0.000 | 0.000 |
0.000 0.000 | 0.000 |
0.145 0.068 | 0.193 |
0.000 0.000 | 0.057 |
0.356 0.308 | 0.388 |
0.322 0.300 | 0.341 |
0.177 0.157 | 0.193 |
| 5 spectra, EVTDLQEEGK | 0.000 | 0.000 | 0.000 | 0.000 | 0.018 | 0.386 | 0.365 | 0.232 | ||
| 1 spectrum, ARPEDVVNLDLK | 0.000 | 0.000 | 0.103 | 0.378 | 0.017 | 0.097 | 0.262 | 0.143 | ||
| 1 spectrum, VLYTLFTK | 0.000 | 0.000 | 0.000 | 0.215 | 0.000 | 0.416 | 0.221 | 0.148 | ||
| 1 spectrum, QLEEDLYDGQVLQK | 0.054 | 0.000 | 0.000 | 0.000 | 0.244 | 0.262 | 0.295 | 0.145 |
| Plot | Lyso | Other | |||||||||||
| Expt C |
3 peptides |
5 spectra |
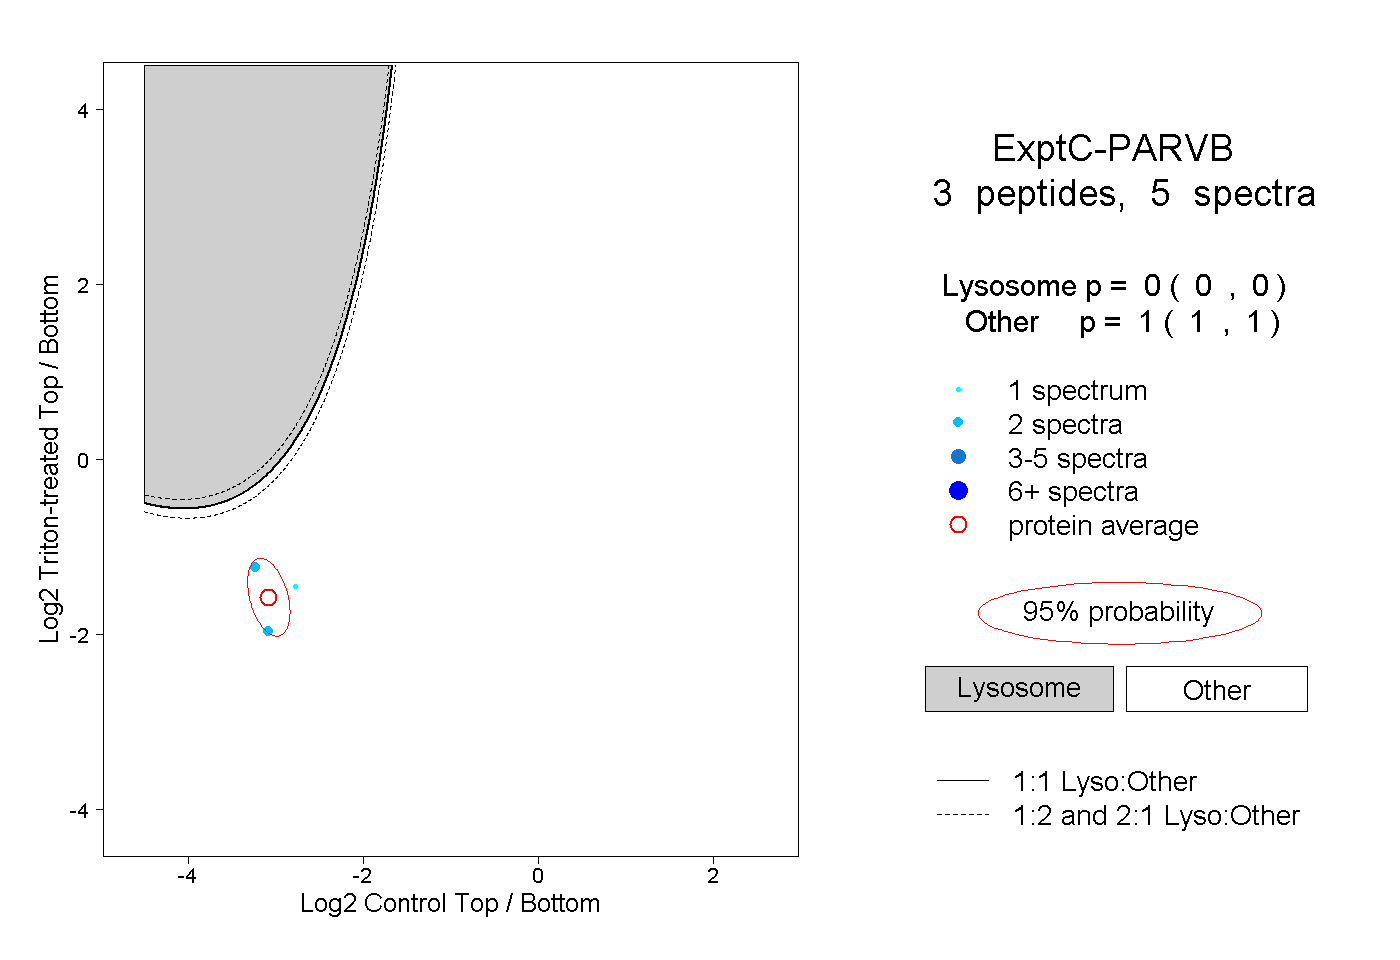 |
0.000 0.000 | 0.000 |
1.000 1.000 | 1.000 |