 1
1peptide
spectrum
NA | NA
NA | NA
NA | NA
NA | NA
NA | NA
NA | NA
NA | NA
NA | NA
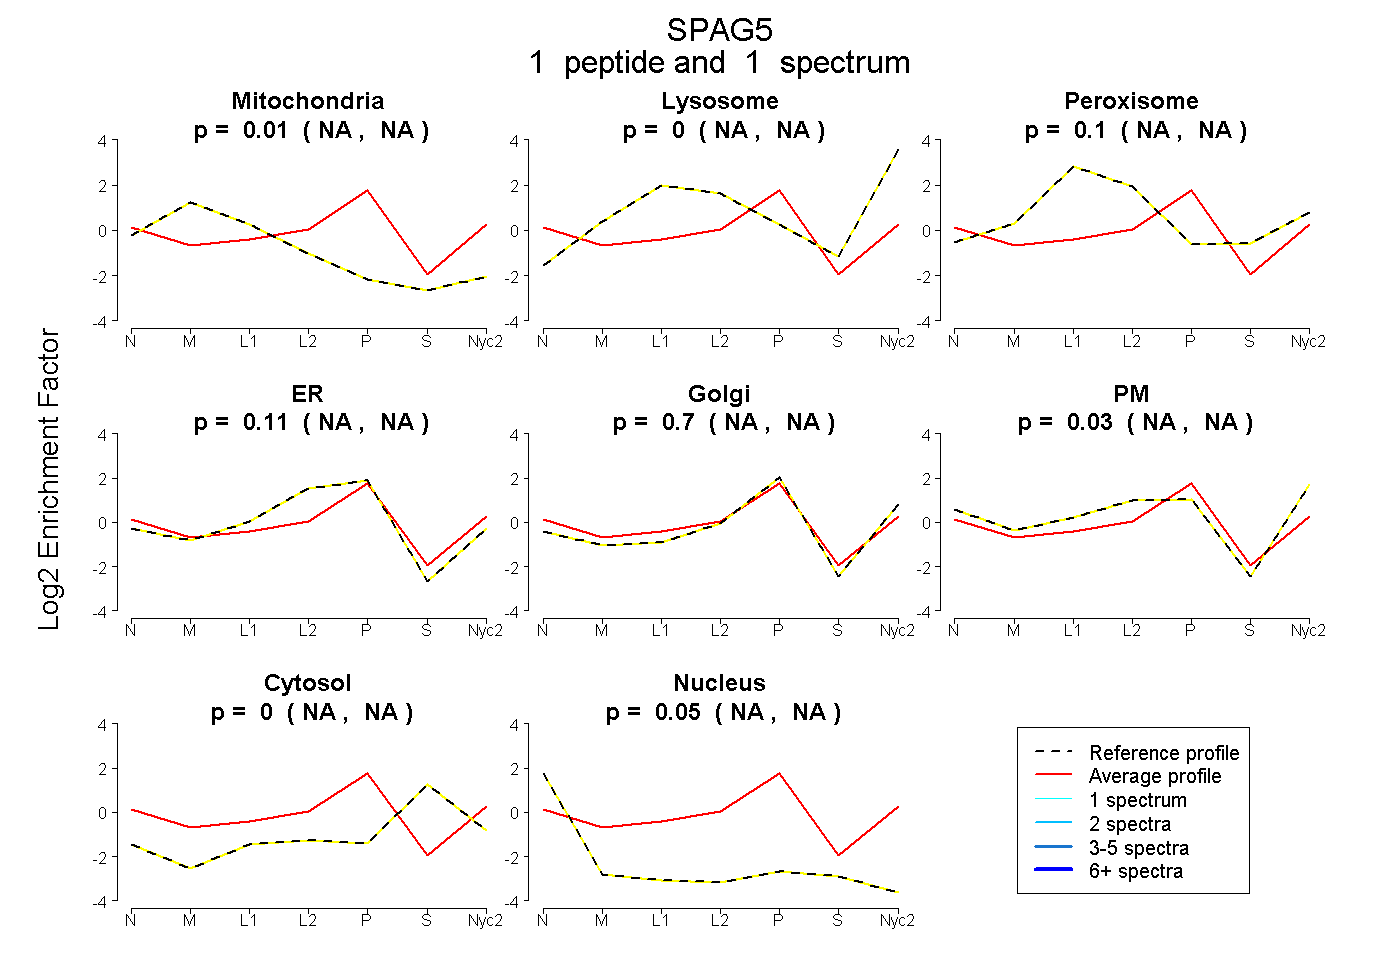
| Plot | Mito | Lyso | Perox | ER | Golgi | PM | Cytosol | Nucleus | |||||
| Expt A |
1 peptide |
1 spectrum |
|
0.009 NA | NA |
0.000 NA | NA |
0.100 NA | NA |
0.115 NA | NA |
0.695 NA | NA |
0.029 NA | NA |
0.000 NA | NA |
0.051 NA | NA |
| 1 spectrum, SQLTVPSR | 0.009 | 0.000 | 0.100 | 0.115 | 0.695 | 0.029 | 0.000 | 0.051 |