 6
6peptides
spectra
0.000 | 0.000
0.000 | 0.000
0.000 | 0.000
0.396 | 0.505
0.252 | 0.378
0.000 | 0.000
0.123 | 0.222
0.015 | 0.068
| Plot | Mito | Lyso | Perox | ER | Golgi | PM | Cytosol | Nucleus | |||||
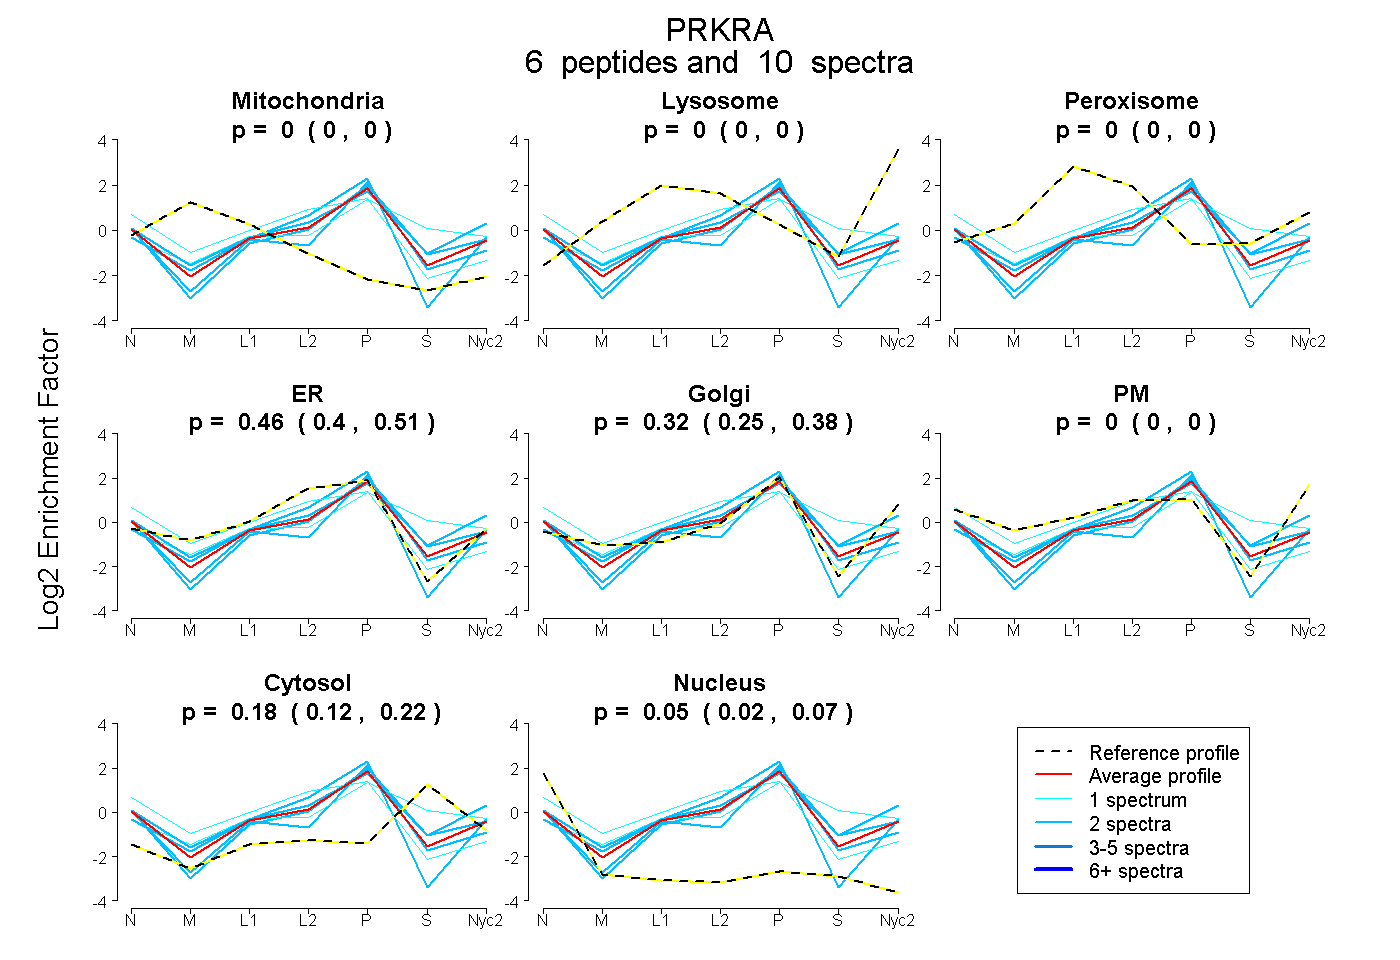
| Expt A |
6 peptides |
10 spectra |
|
0.000 0.000 | 0.000 |
0.000 0.000 | 0.000 |
0.000 0.000 | 0.000 |
0.457 0.396 | 0.505 |
0.319 0.252 | 0.378 |
0.000 0.000 | 0.000 |
0.179 0.123 | 0.222 |
0.045 0.015 | 0.068 |
| 1 spectrum, TPIQVLHEYGMK | 0.000 | 0.000 | 0.064 | 0.777 | 0.000 | 0.000 | 0.000 | 0.159 | ||
| 2 spectra, SDVQVHVPTFTFR | 0.000 | 0.000 | 0.000 | 0.283 | 0.348 | 0.152 | 0.217 | 0.000 | ||
| 2 spectra, AEAPPLQR | 0.000 | 0.000 | 0.000 | 0.259 | 0.474 | 0.000 | 0.138 | 0.130 | ||
| 1 spectrum, LESFMETGK | 0.000 | 0.000 | 0.097 | 0.185 | 0.318 | 0.000 | 0.400 | 0.000 | ||
| 2 spectra, AAEAAINILK | 0.000 | 0.000 | 0.000 | 0.320 | 0.378 | 0.000 | 0.278 | 0.024 | ||
| 2 spectra, LNLLK | 0.000 | 0.000 | 0.000 | 0.637 | 0.309 | 0.000 | 0.000 | 0.053 |
| Plot | Mito | Lyso or Perox | ER | Golgi | PM | Cytosol | Nucleus | ||||||
| Expt B |
2 peptides |
3 spectra |
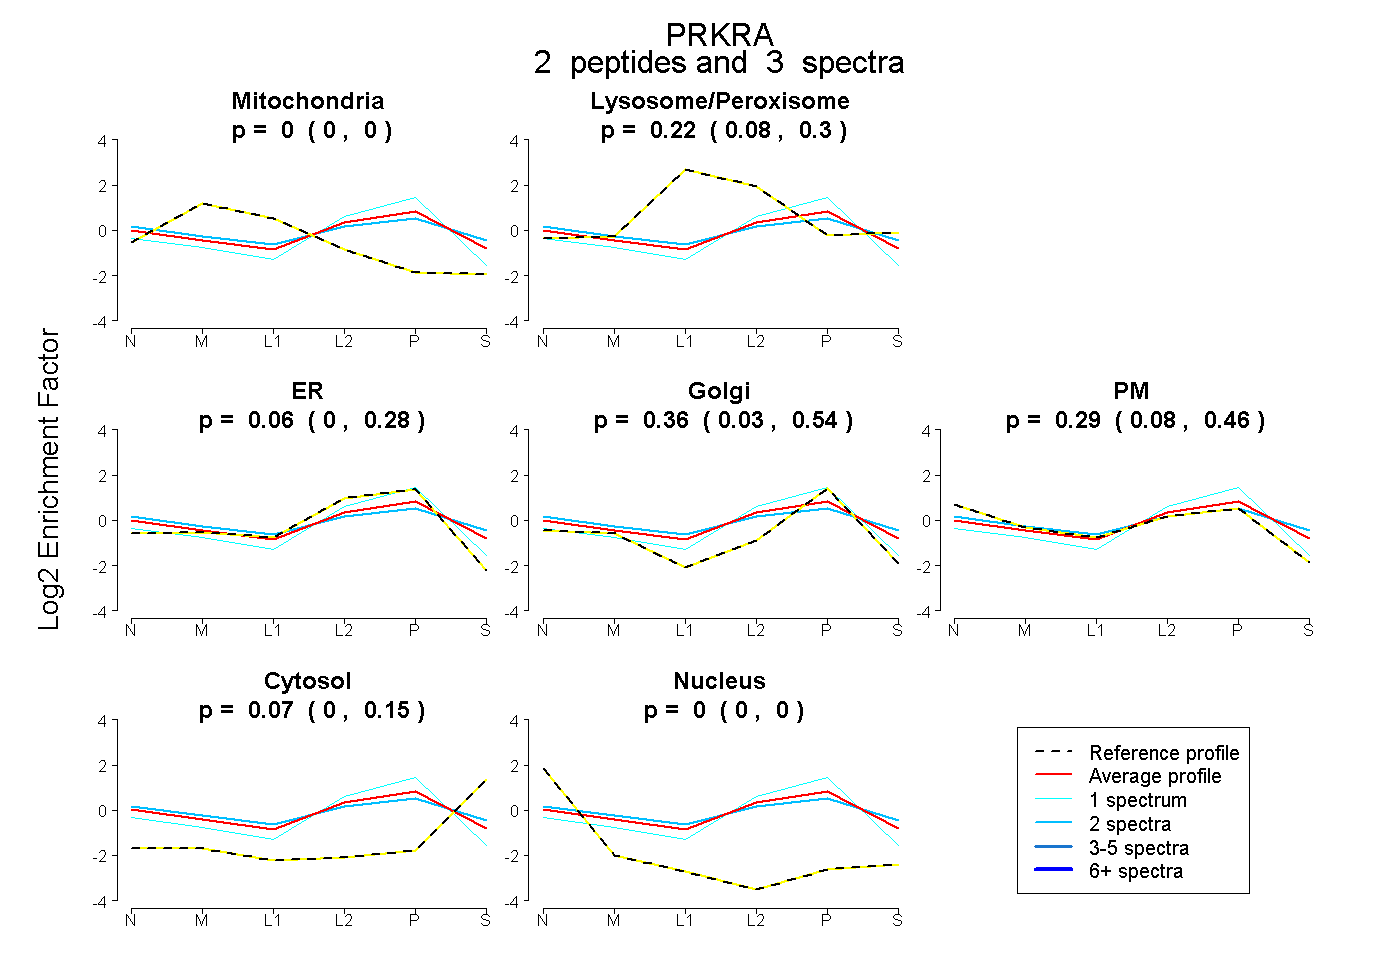 |
0.000 0.000 | 0.000 |
0.219 0.076 | 0.297 |
0.061 0.000 | 0.275 |
0.360 0.033 | 0.537 |
0.286 0.076 | 0.458 |
0.074 0.000 | 0.153 |
0.000 0.000 | 0.000 |
|||
| Plot | Lyso | Other | |||||||||||
| Expt C |
2 peptides |
5 spectra |
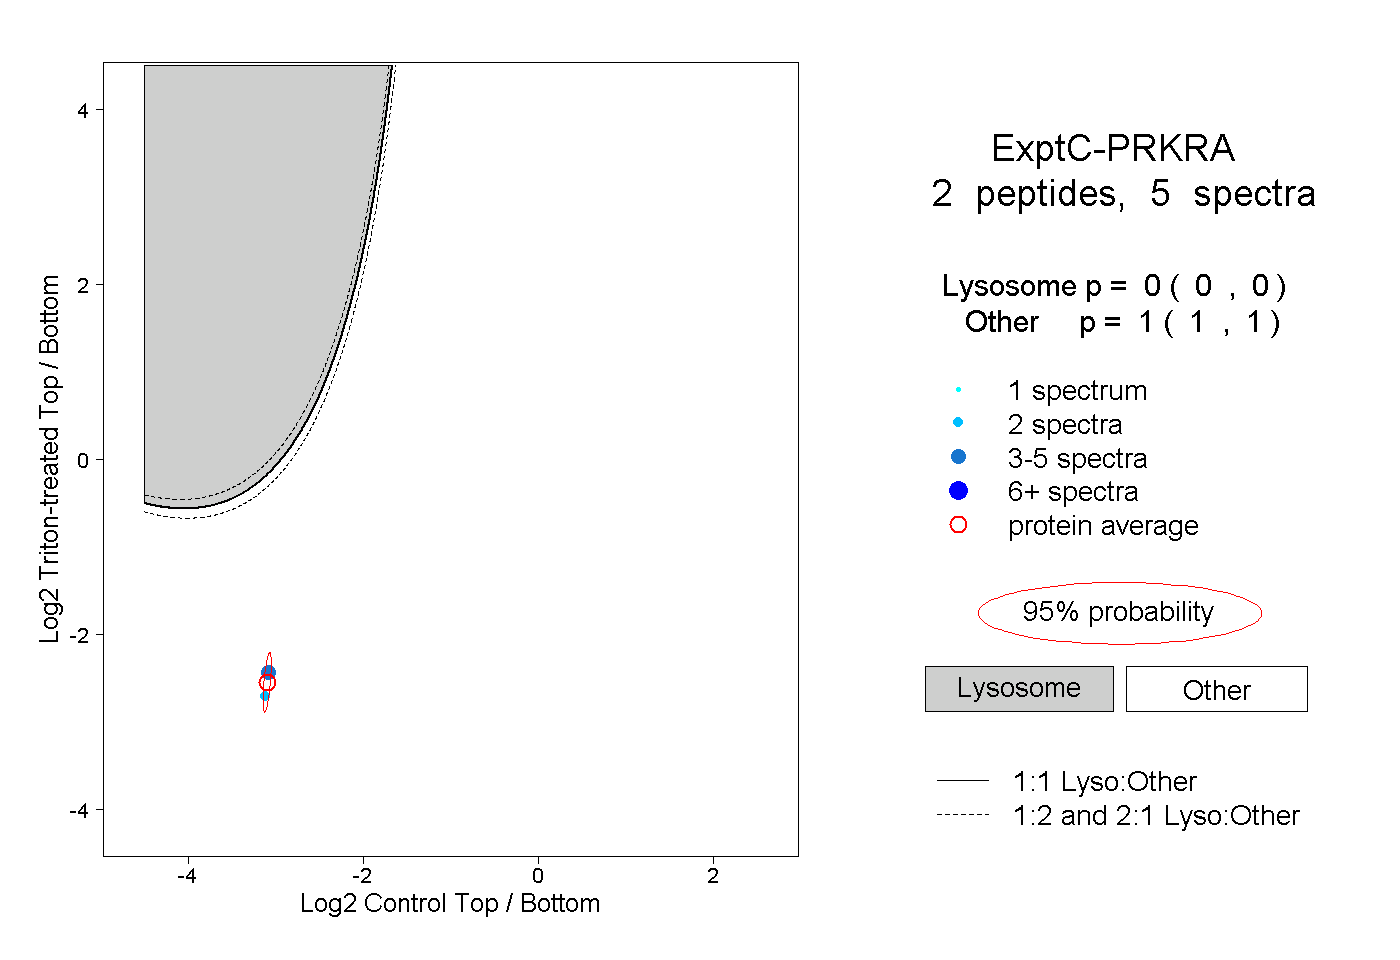 |
0.000 0.000 | 0.000 |
1.000 1.000 | 1.000 |
||||||||
| Plot | Lyso | Other | |||||||||||
| Expt D |
1 peptide |
1 spectrum |
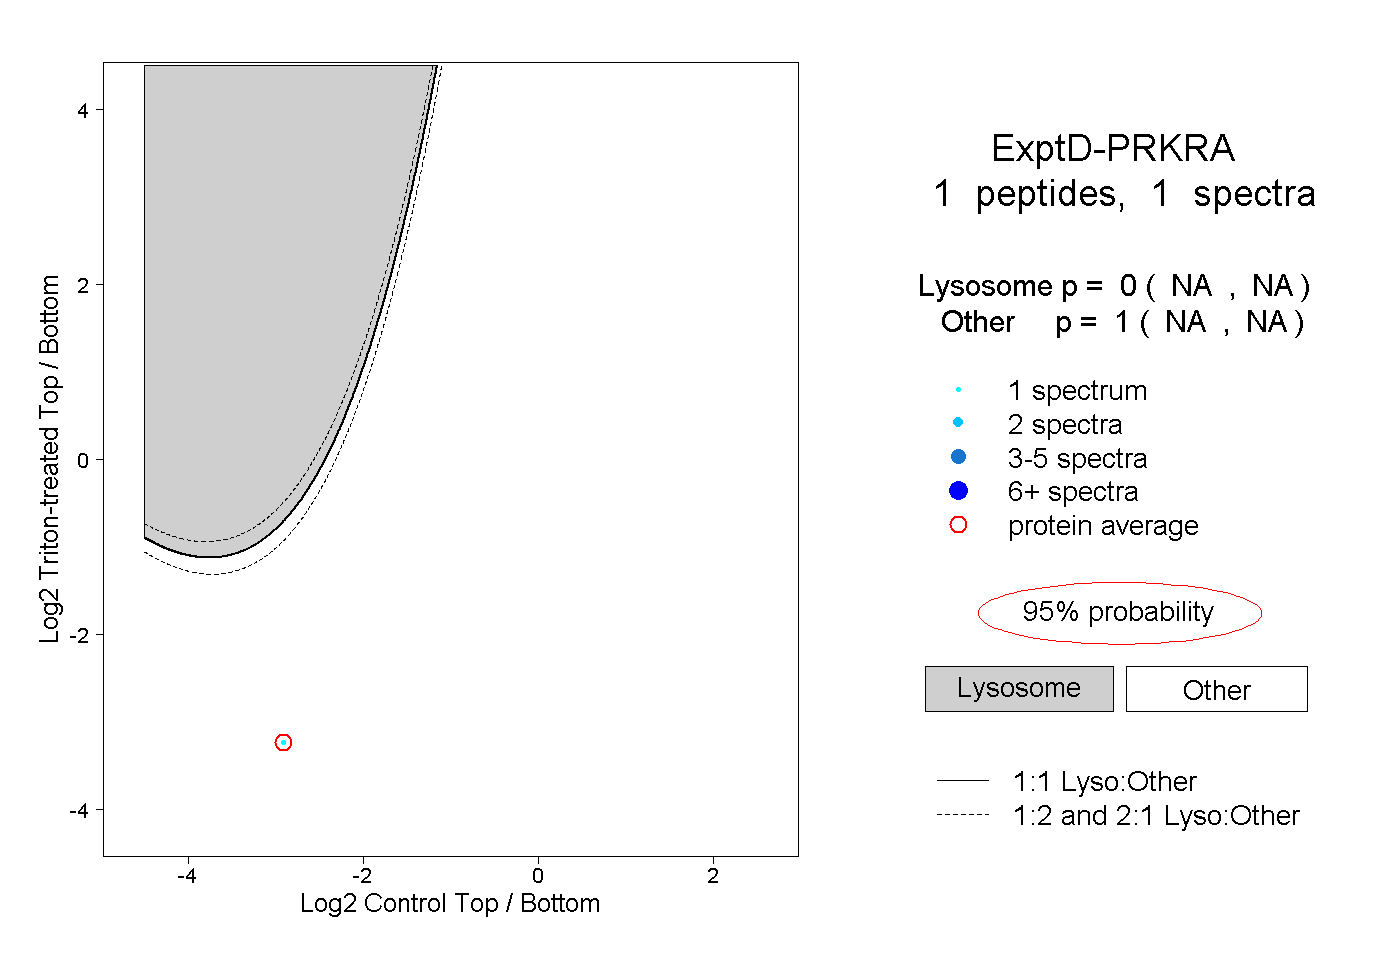 |
0.000 NA | NA |
1.000 NA | NA |