 15
15peptides
spectra
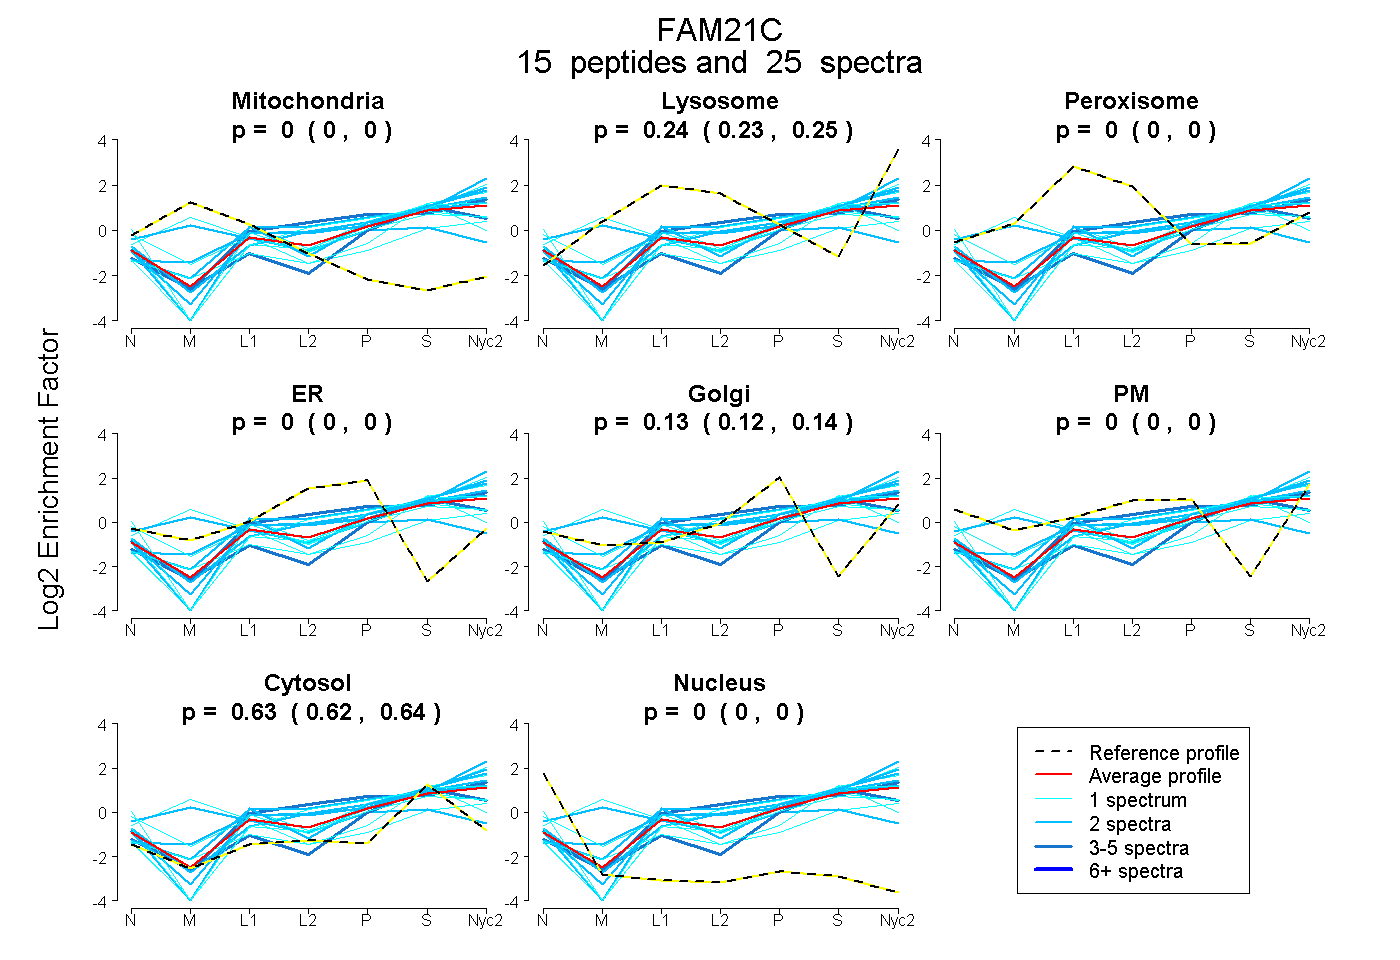
0.000 | 0.000
0.225 | 0.251
0.000 | 0.000
0.000 | 0.000
0.121 | 0.140
0.000 | 0.000
0.618 | 0.638
0.000 | 0.000
4peptides
spectra
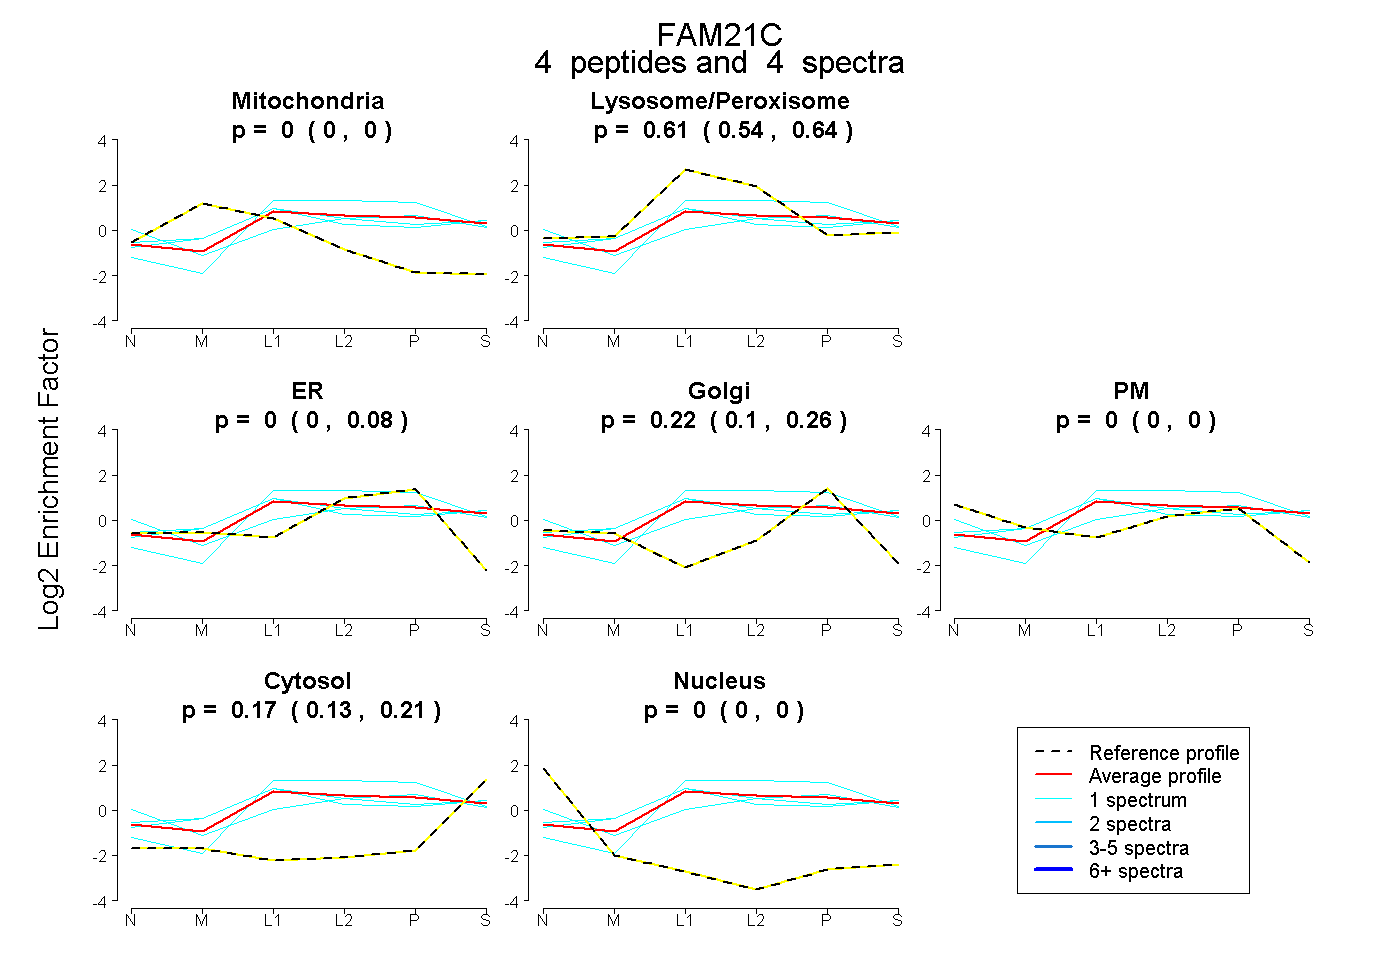
0.000 | 0.000
0.544 | 0.639
0.000 | 0.077
0.096 | 0.264
0.000 | 0.000
0.128 | 0.213
0.000 | 0.000
10peptides
spectra
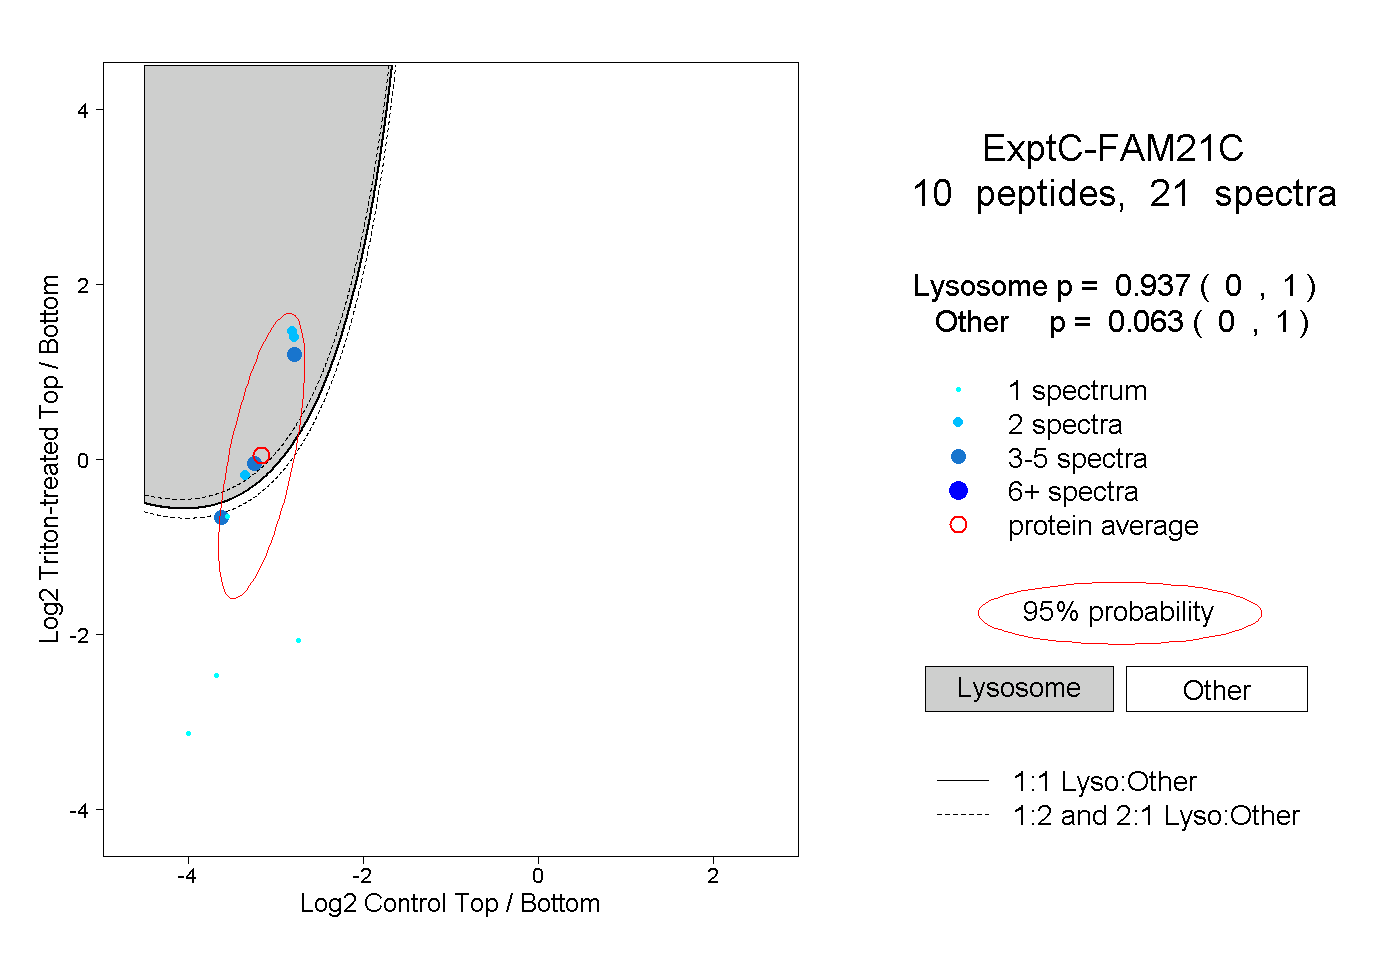
0.000 | 1.000
0.000 | 1.000
1peptide
spectrum
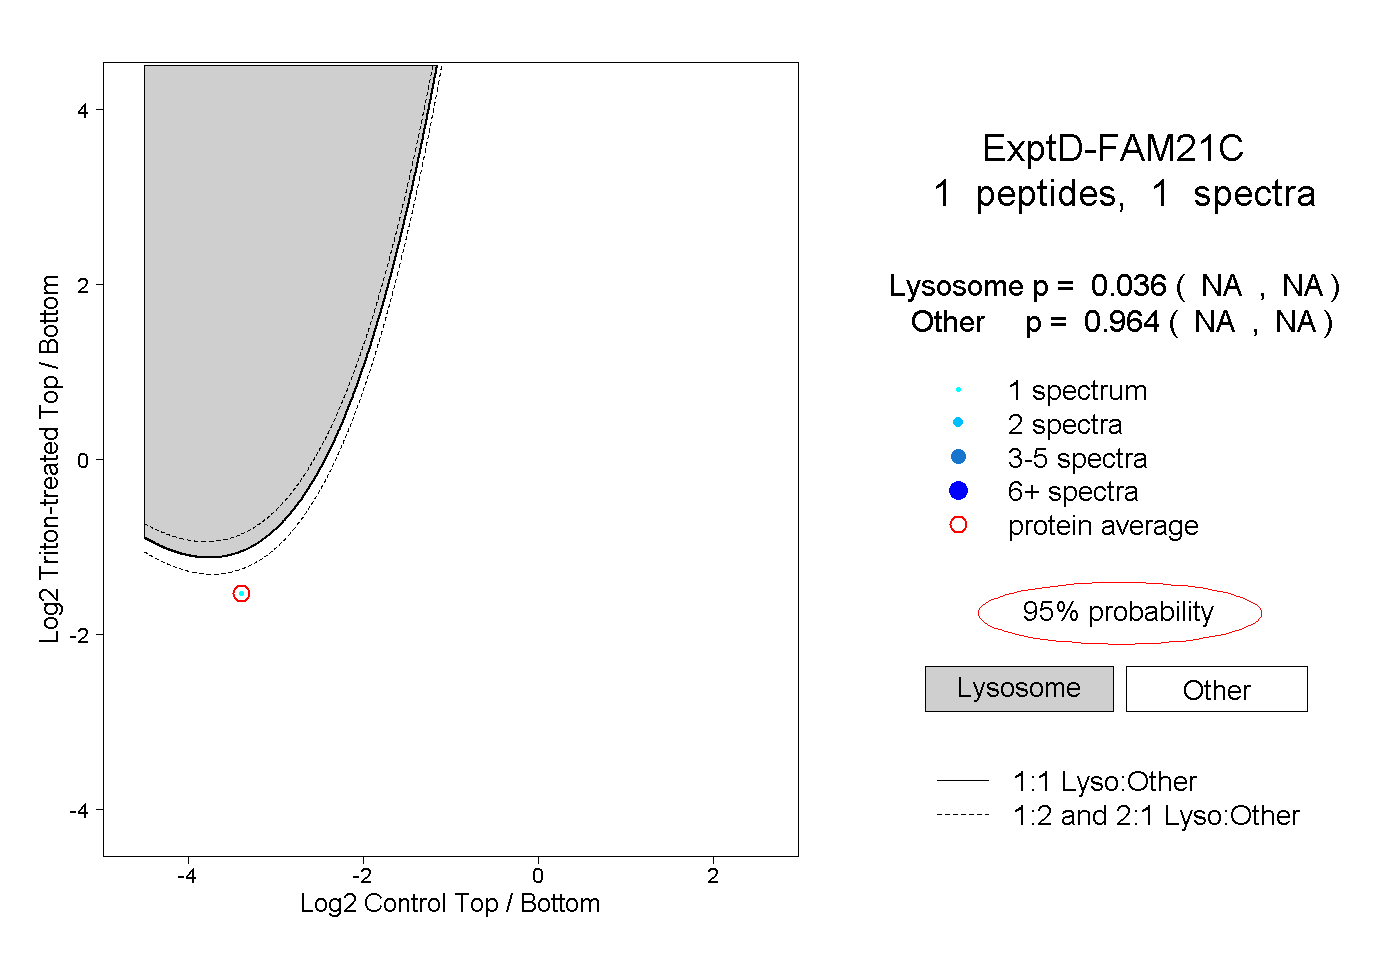
NA | NA
NA | NA