 9
9peptides
spectra
0.010 | 0.083
0.000 | 0.000
0.000 | 0.011
0.000 | 0.043
0.000 | 0.028
0.000 | 0.000
0.584 | 0.619
0.296 | 0.350
| Plot | Mito | Lyso | Perox | ER | Golgi | PM | Cytosol | Nucleus | |||||
| Expt A |
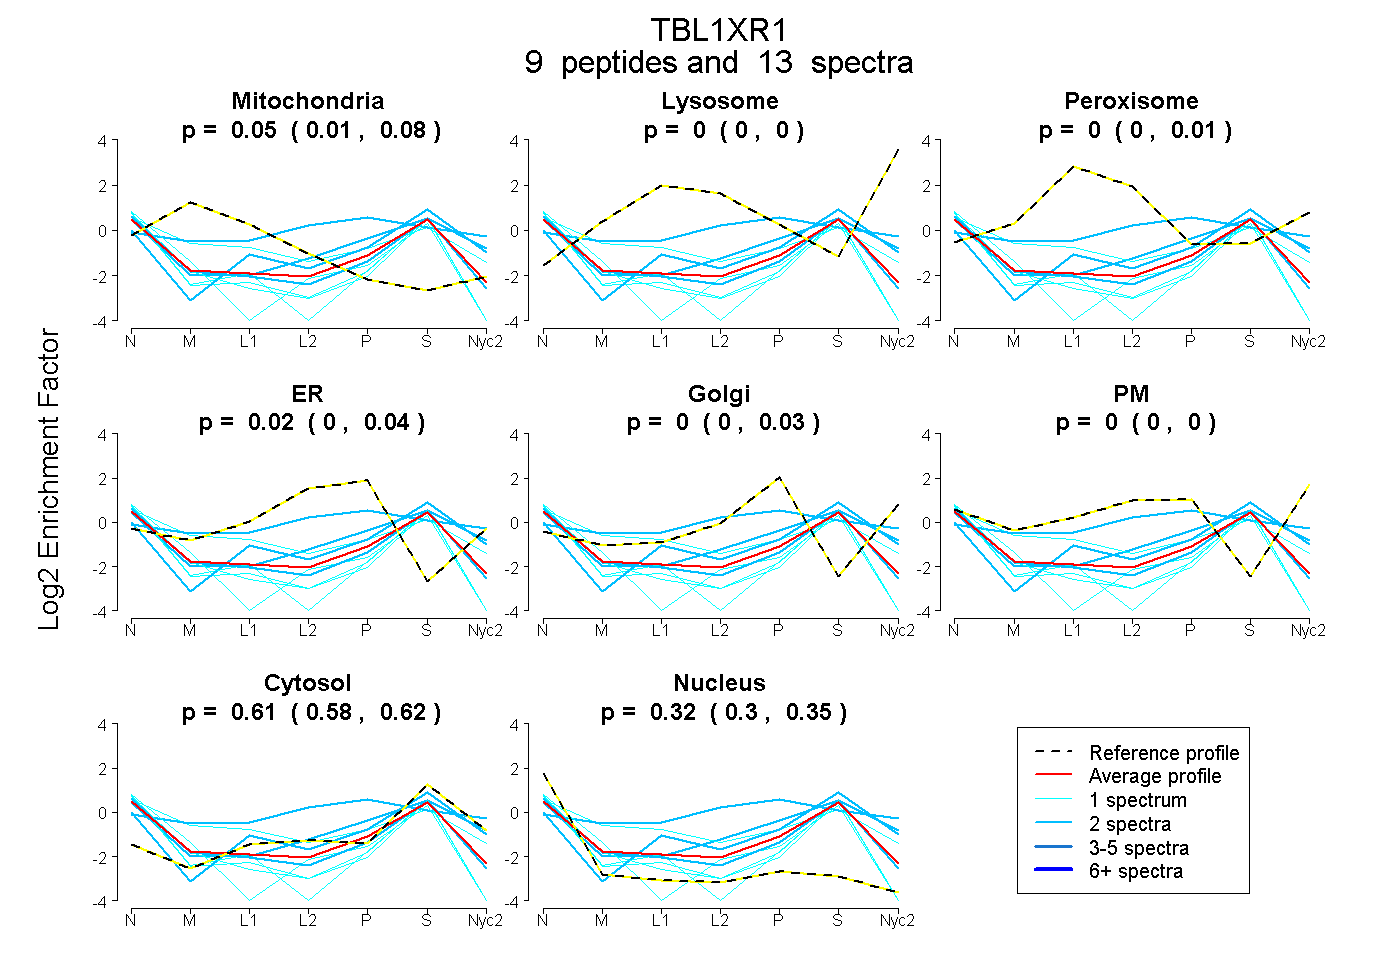
9 peptides |
13 spectra |
|
0.053 0.010 | 0.083 |
0.000 0.000 | 0.000 |
0.000 0.000 | 0.011 |
0.018 0.000 | 0.043 |
0.000 0.000 | 0.028 |
0.000 0.000 | 0.000 |
0.605 0.584 | 0.619 |
0.324 0.296 | 0.350 |