 5
5peptides
spectra
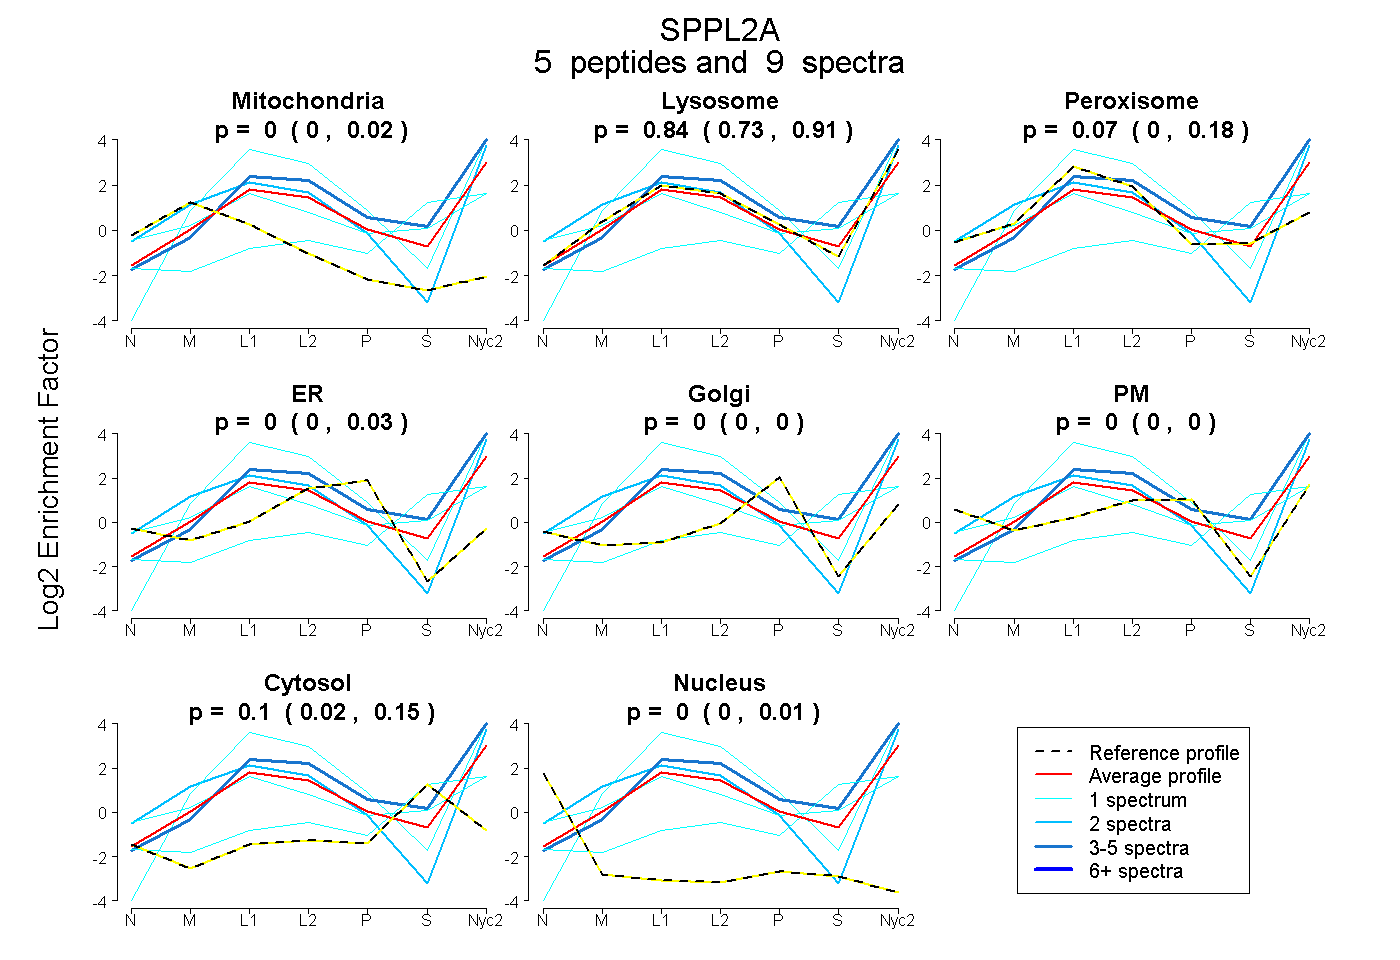
0.000 | 0.018
0.726 | 0.911
0.000 | 0.178
0.000 | 0.030
0.000 | 0.000
0.000 | 0.000
0.020 | 0.145
0.000 | 0.012
1peptide
spectra
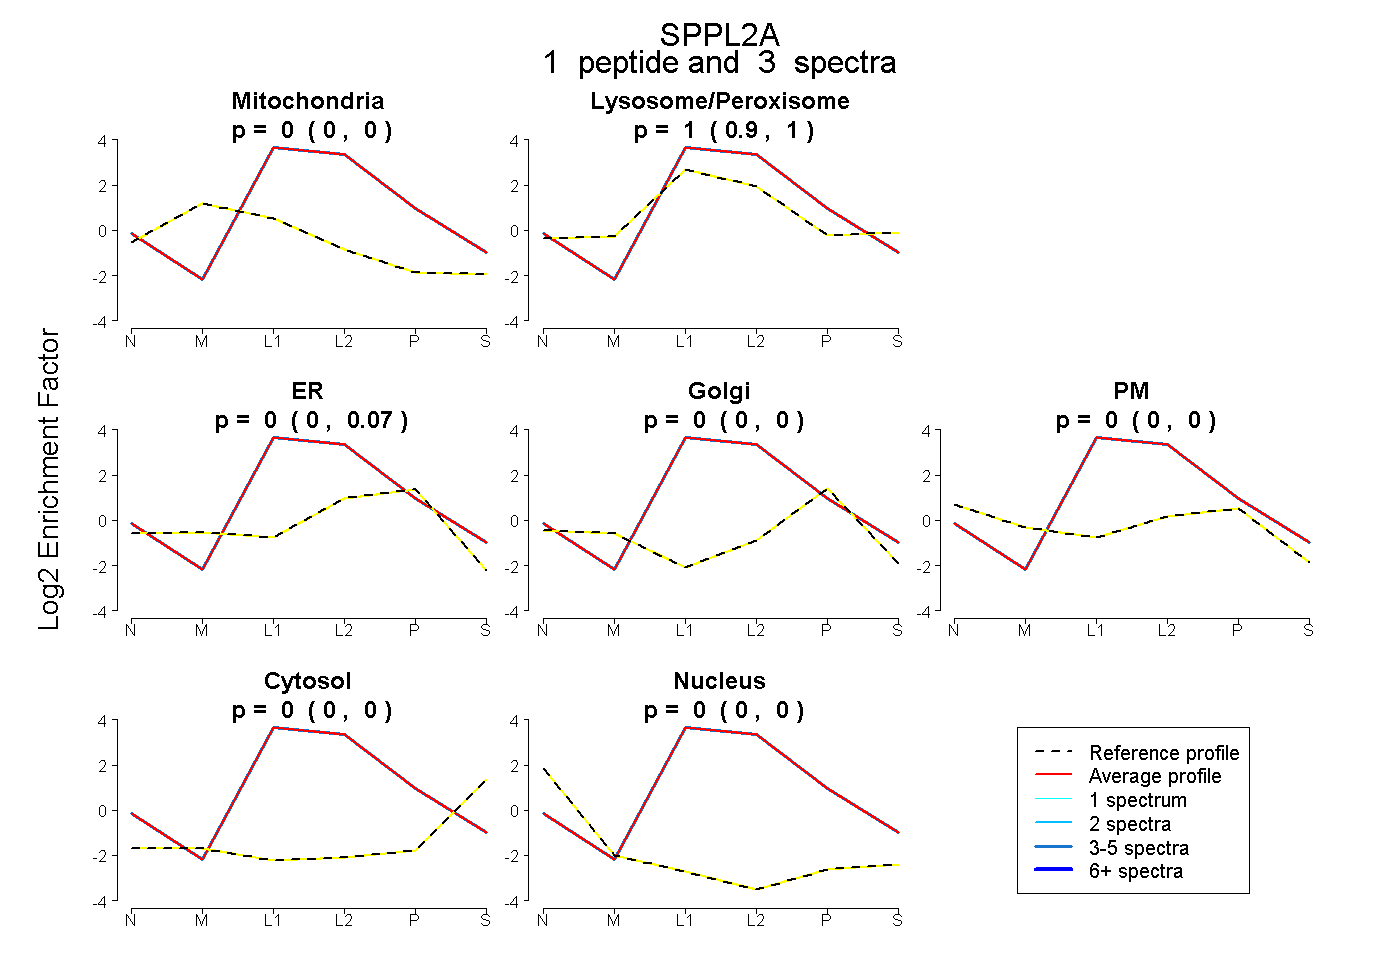
0.000 | 0.000
0.905 | 1.000
0.000 | 0.073
0.000 | 0.000
0.000 | 0.000
0.000 | 0.000
0.000 | 0.000
5peptides
spectra
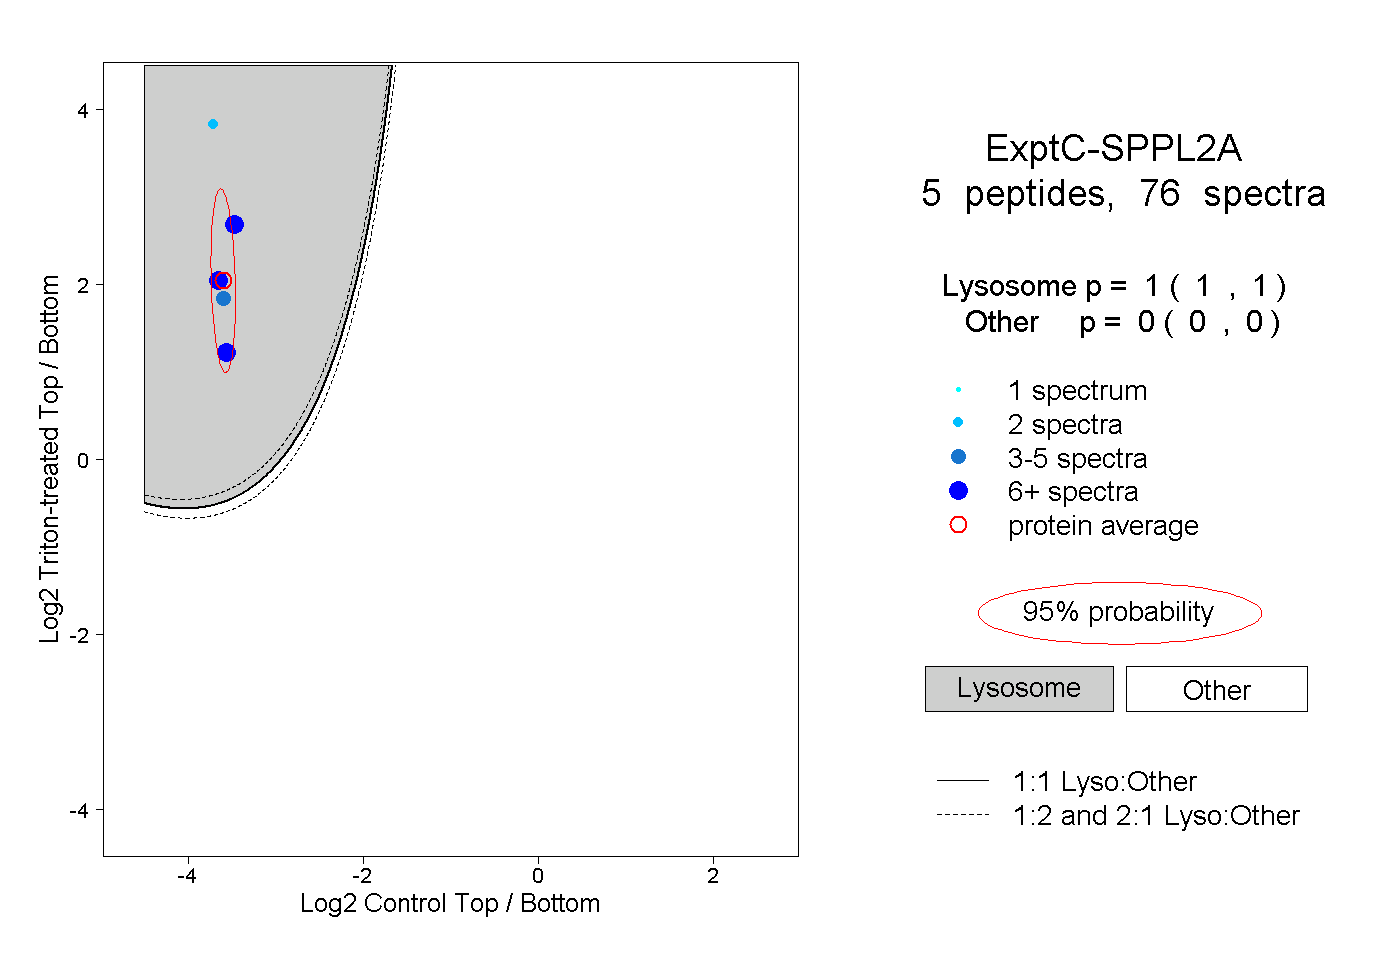
1.000 | 1.000
0.000 | 0.000
1peptide
spectra
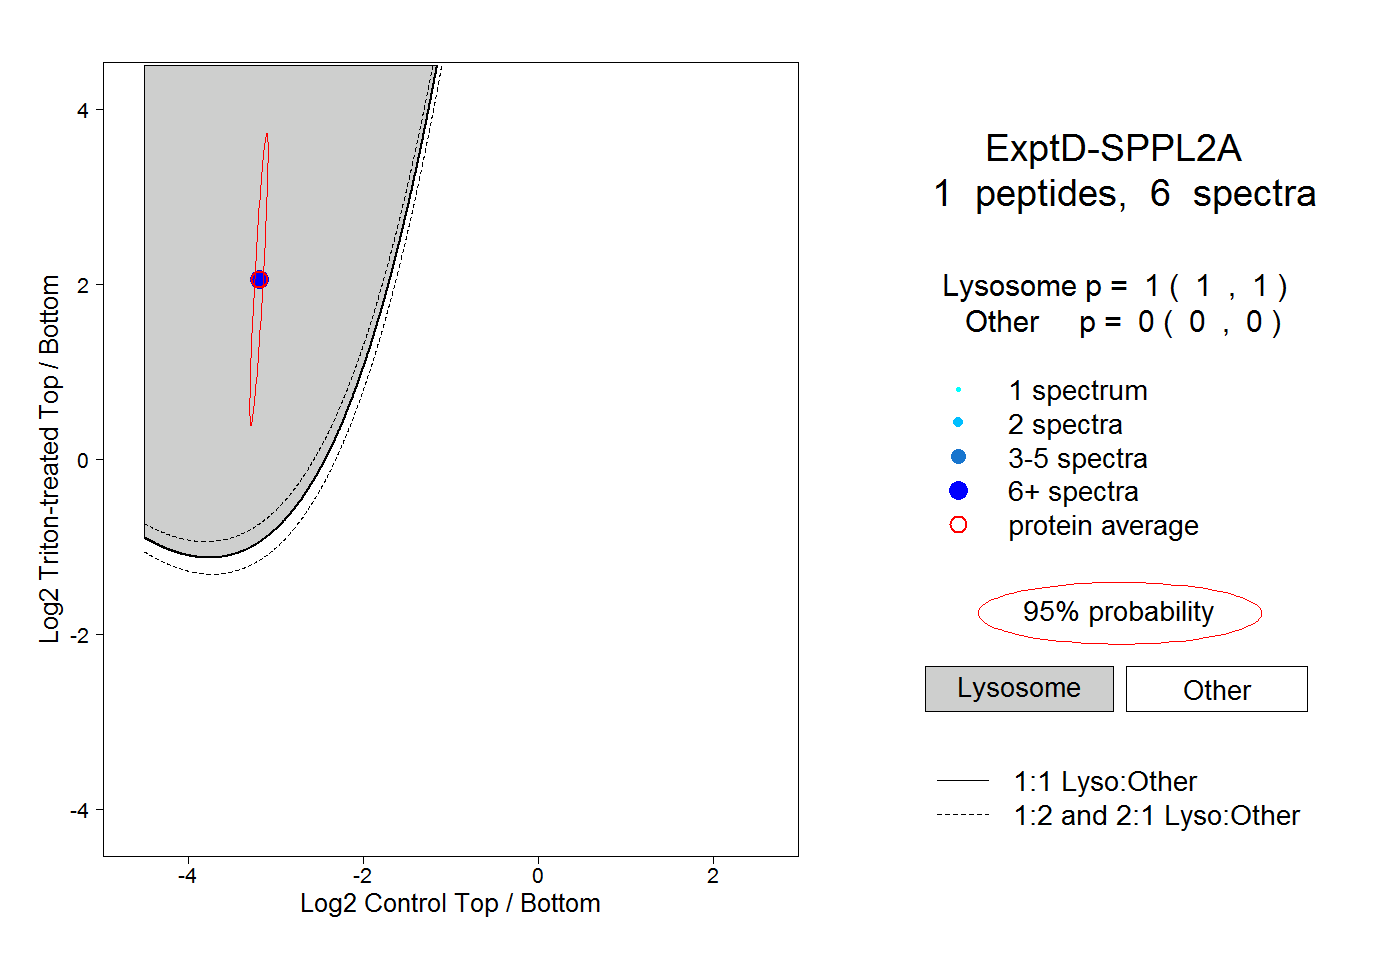
1.000 | 1.000
0.000 | 0.000