 1
1peptide
spectra
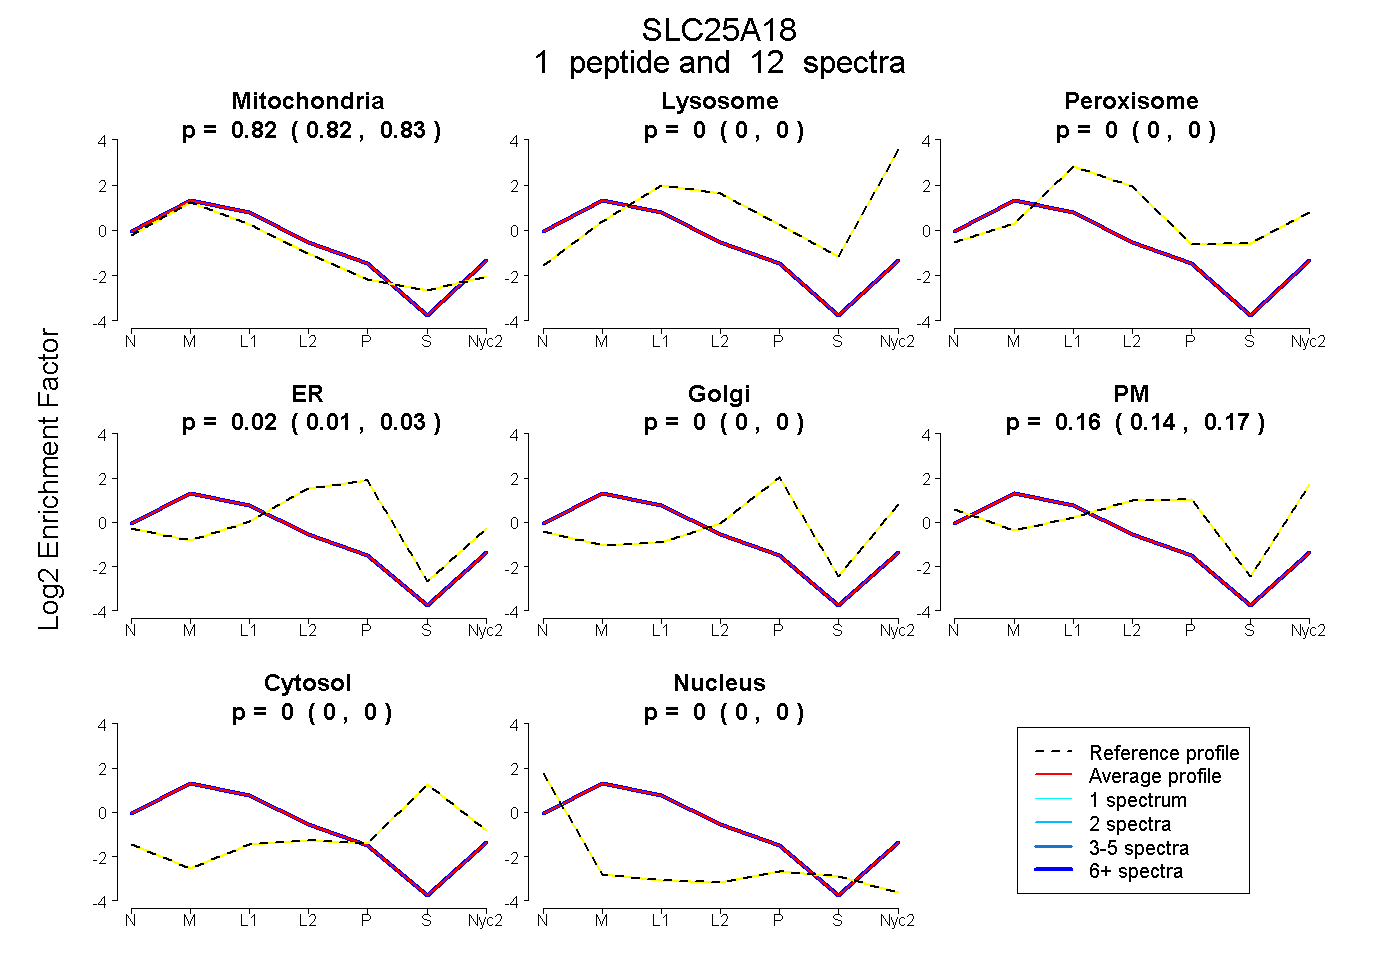
0.816 | 0.825
0.000 | 0.000
0.000 | 0.000
0.008 | 0.032
0.000 | 0.000
0.144 | 0.169
0.000 | 0.000
0.000 | 0.000
1peptide
spectra
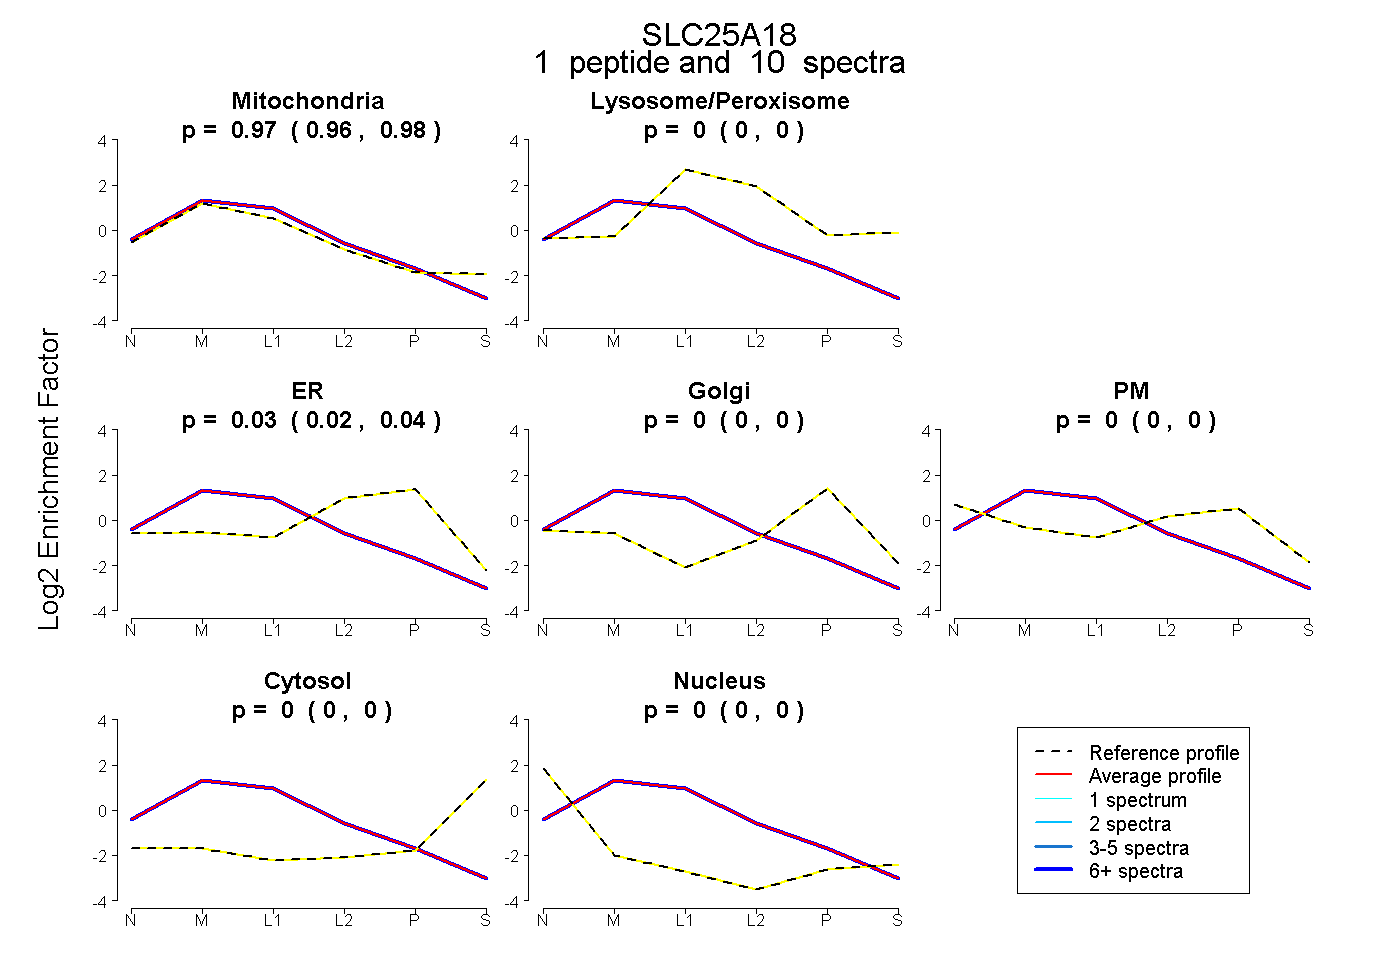
0.957 | 0.979
0.000 | 0.000
0.019 | 0.041
0.000 | 0.000
0.000 | 0.000
0.000 | 0.000
0.000 | 0.000
1peptide
spectra
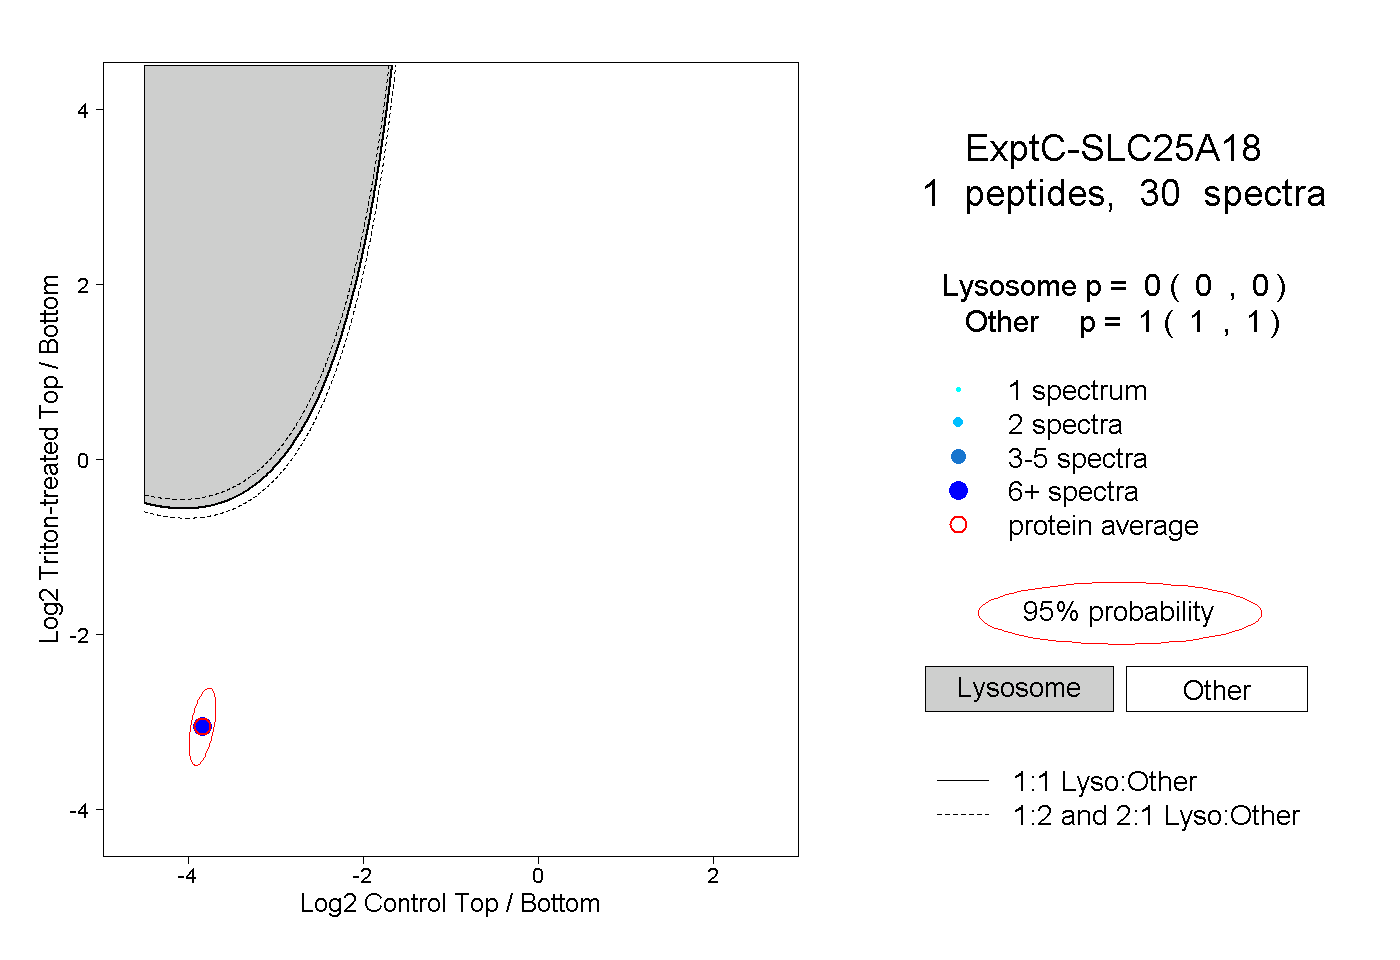
0.000 | 0.000
1.000 | 1.000
1peptide
spectra
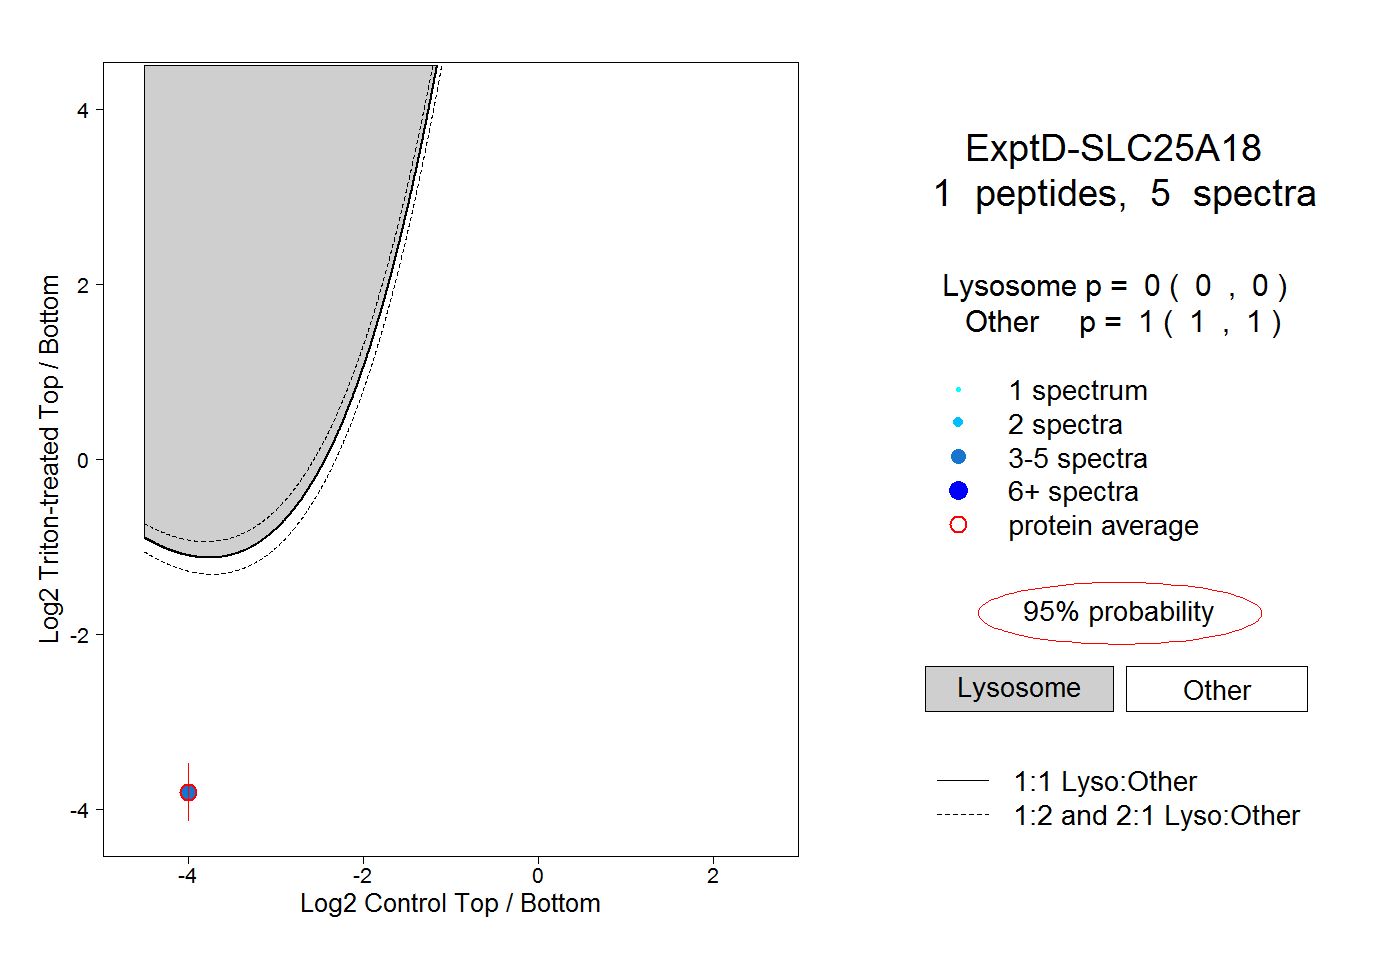
0.000 | 0.000
1.000 | 1.000