 3
3peptides
spectra
0.000 | 0.458
0.000 | 0.212
0.000 | 0.343
0.000 | 0.000
0.000 | 0.000
0.000 | 0.063
0.051 | 0.542
0.064 | 0.527
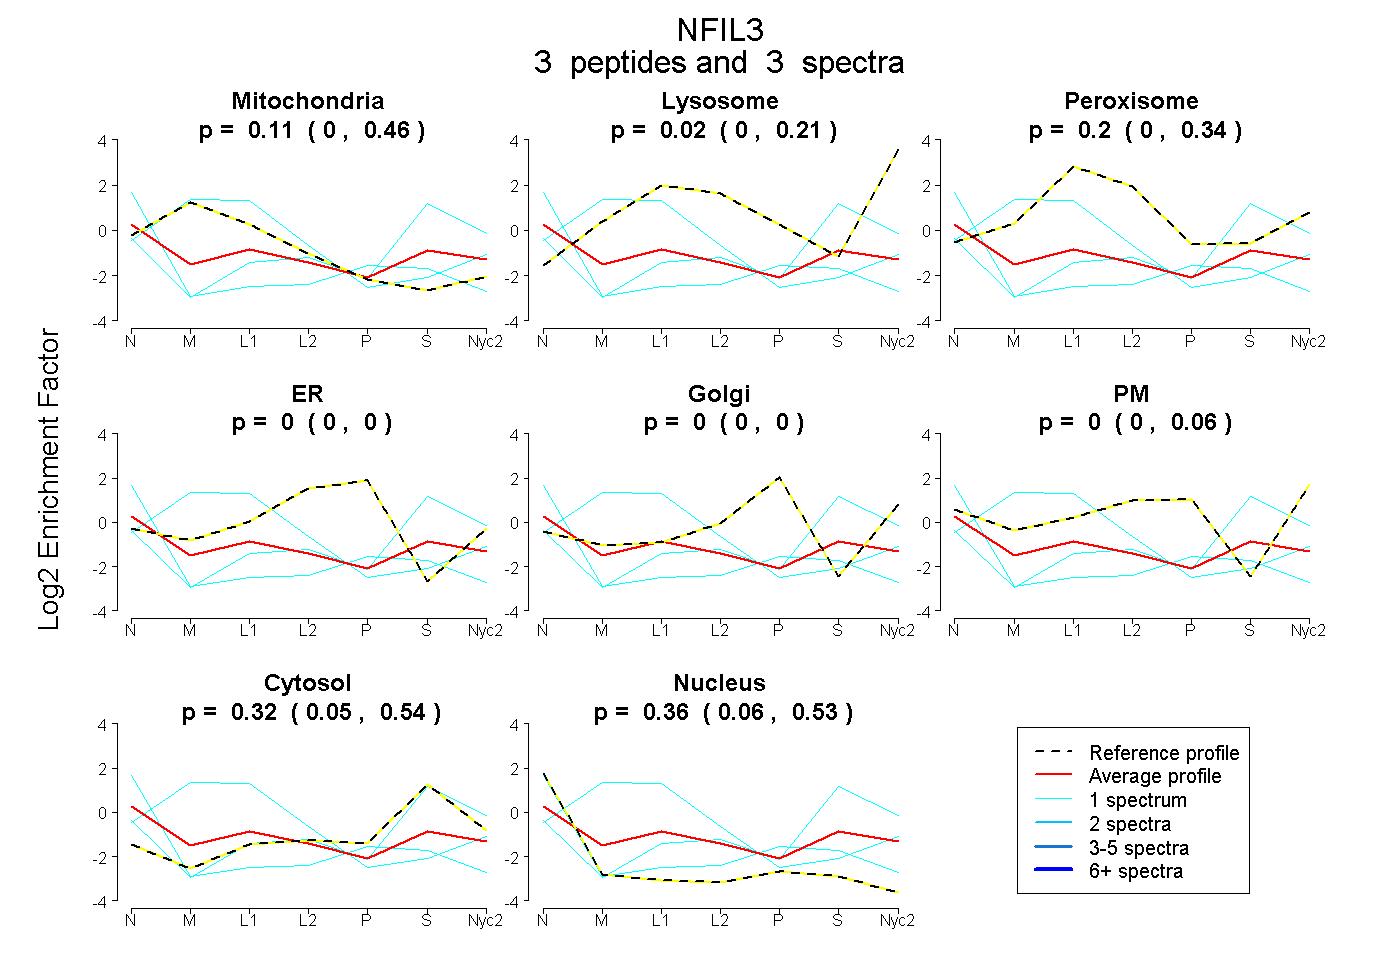
| Plot | Mito | Lyso | Perox | ER | Golgi | PM | Cytosol | Nucleus | |||||
| Expt A |
3 peptides |
3 spectra |
|
0.106 0.000 | 0.458 |
0.019 0.000 | 0.212 |
0.200 0.000 | 0.343 |
0.000 0.000 | 0.000 |
0.000 0.000 | 0.000 |
0.000 0.000 | 0.063 |
0.316 0.051 | 0.542 |
0.358 0.064 | 0.527 |