 3
3peptides
spectra
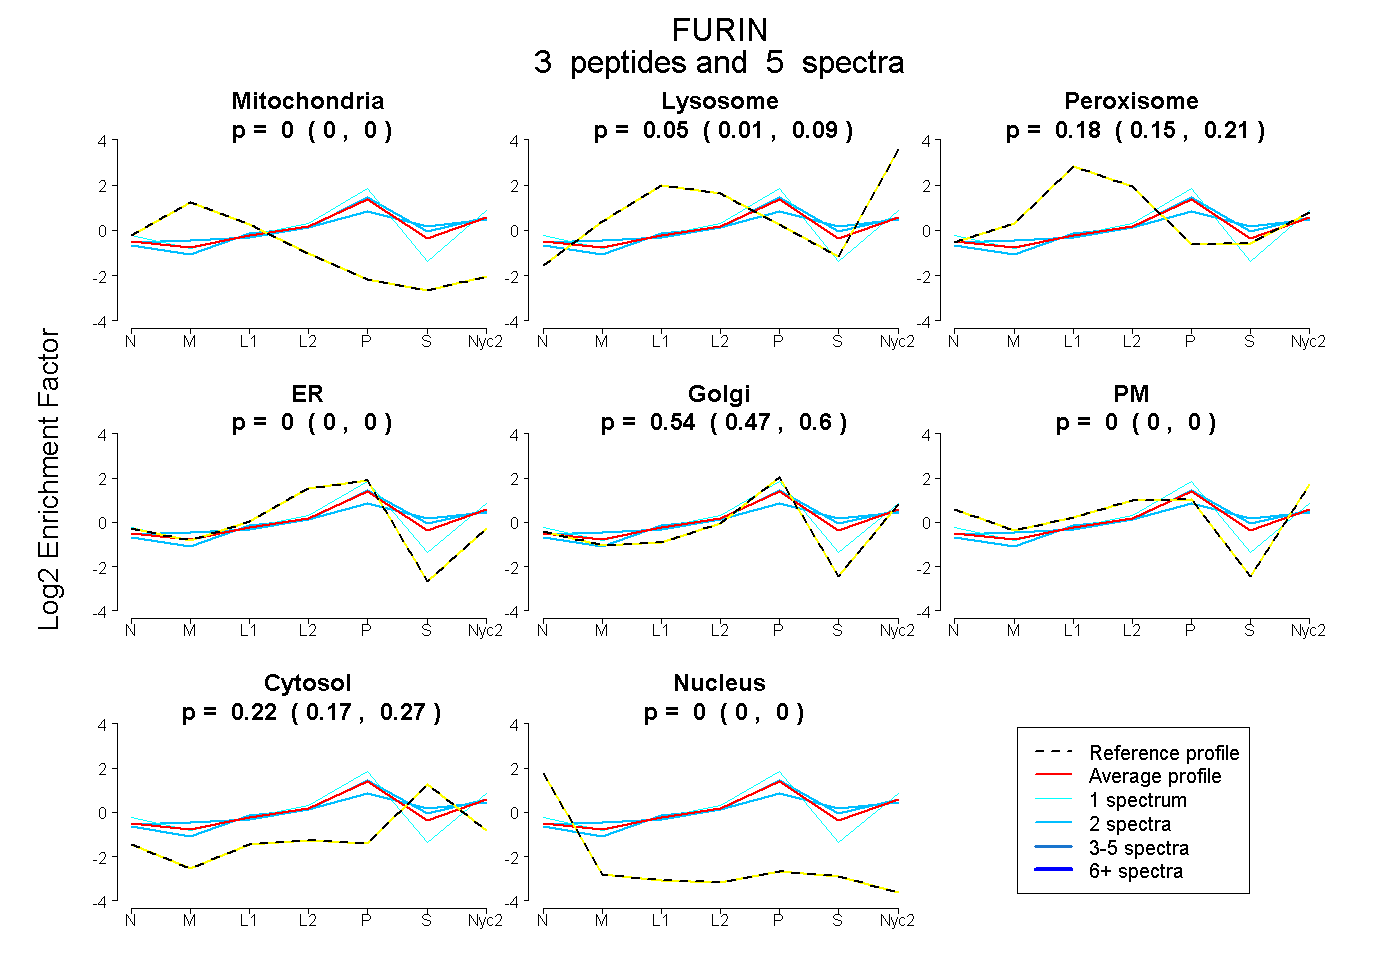
0.000 | 0.000
0.005 | 0.088
0.147 | 0.214
0.000 | 0.000
0.467 | 0.604
0.000 | 0.000
0.171 | 0.269
0.000 | 0.000
1peptide
spectra
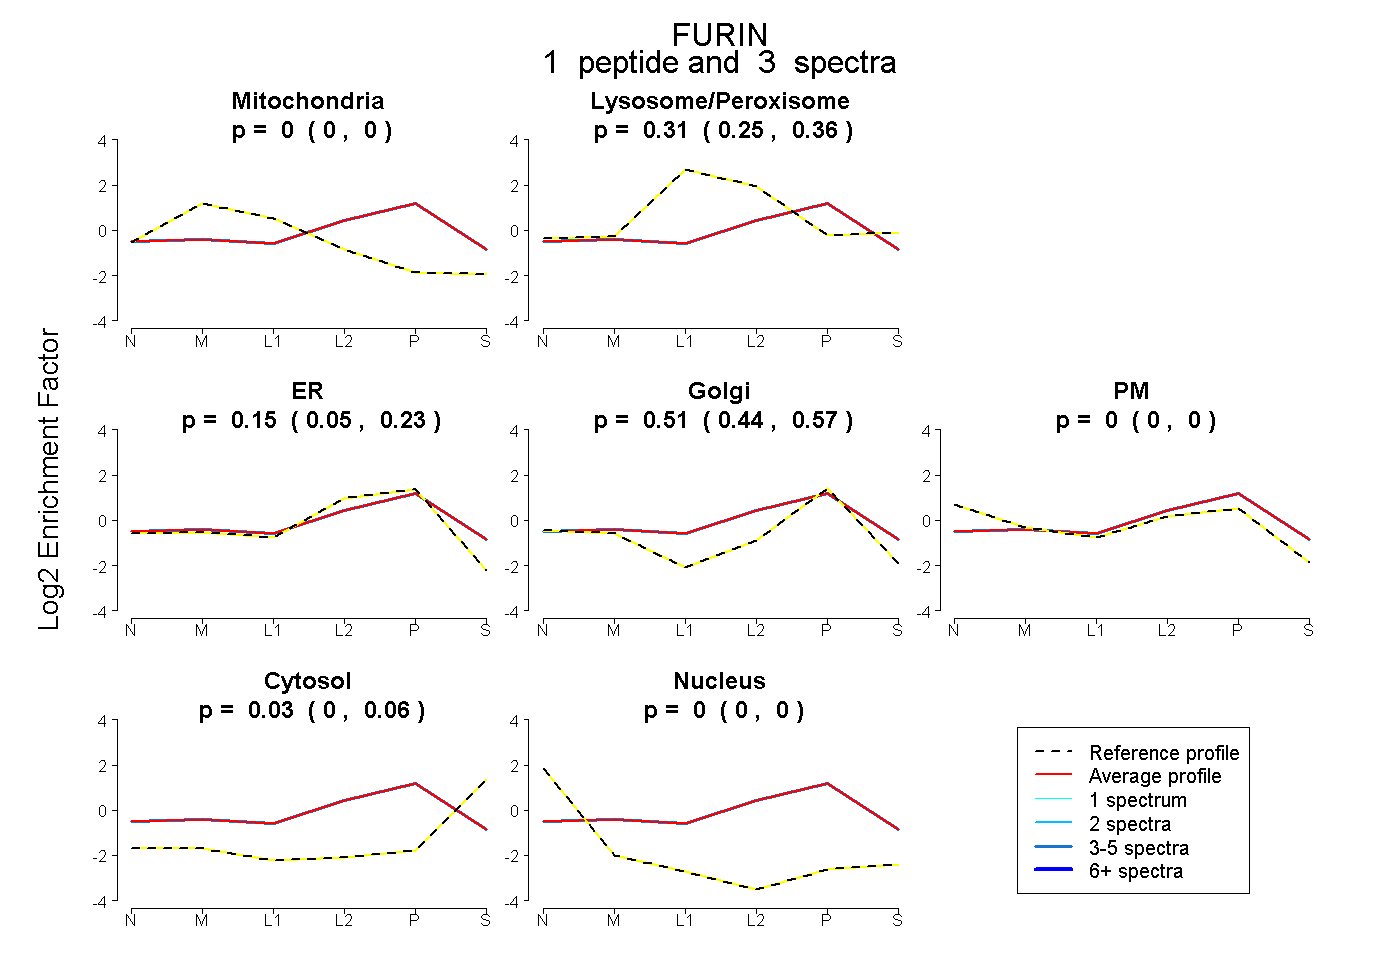
0.000 | 0.000
0.253 | 0.356
0.052 | 0.228
0.438 | 0.568
0.000 | 0.000
0.004 | 0.056
0.000 | 0.000
5peptides
spectra

0.000 | 0.000
1.000 | 1.000
2peptides
spectra

NA | NA
NA | NA