 4
4peptides
spectra
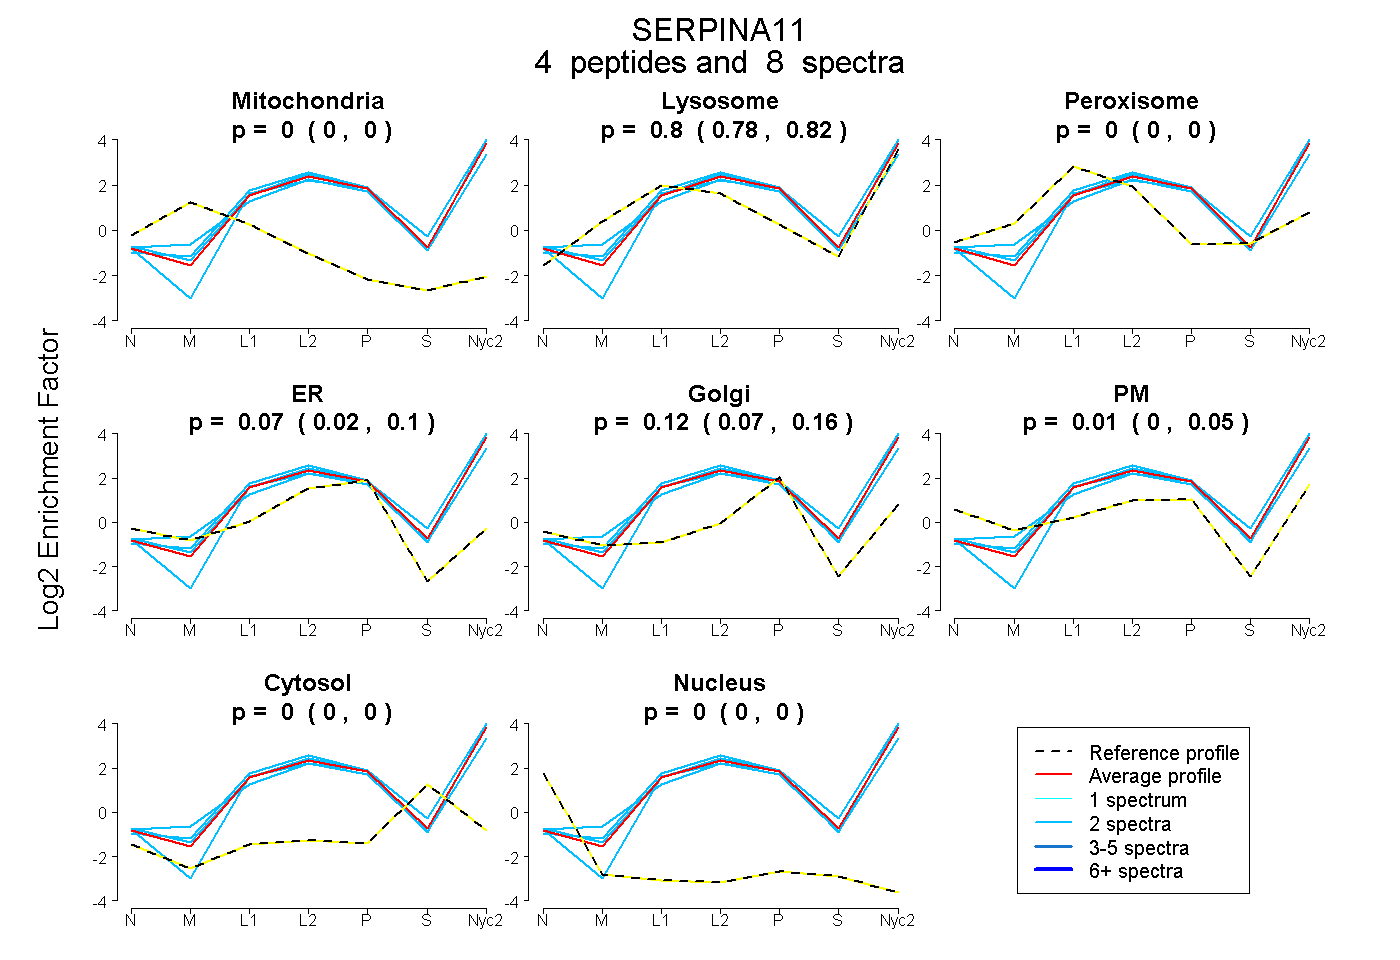
0.000 | 0.000
0.775 | 0.816
0.000 | 0.000
0.024 | 0.102
0.073 | 0.159
0.000 | 0.049
0.000 | 0.000
0.000 | 0.000
2peptides
spectra
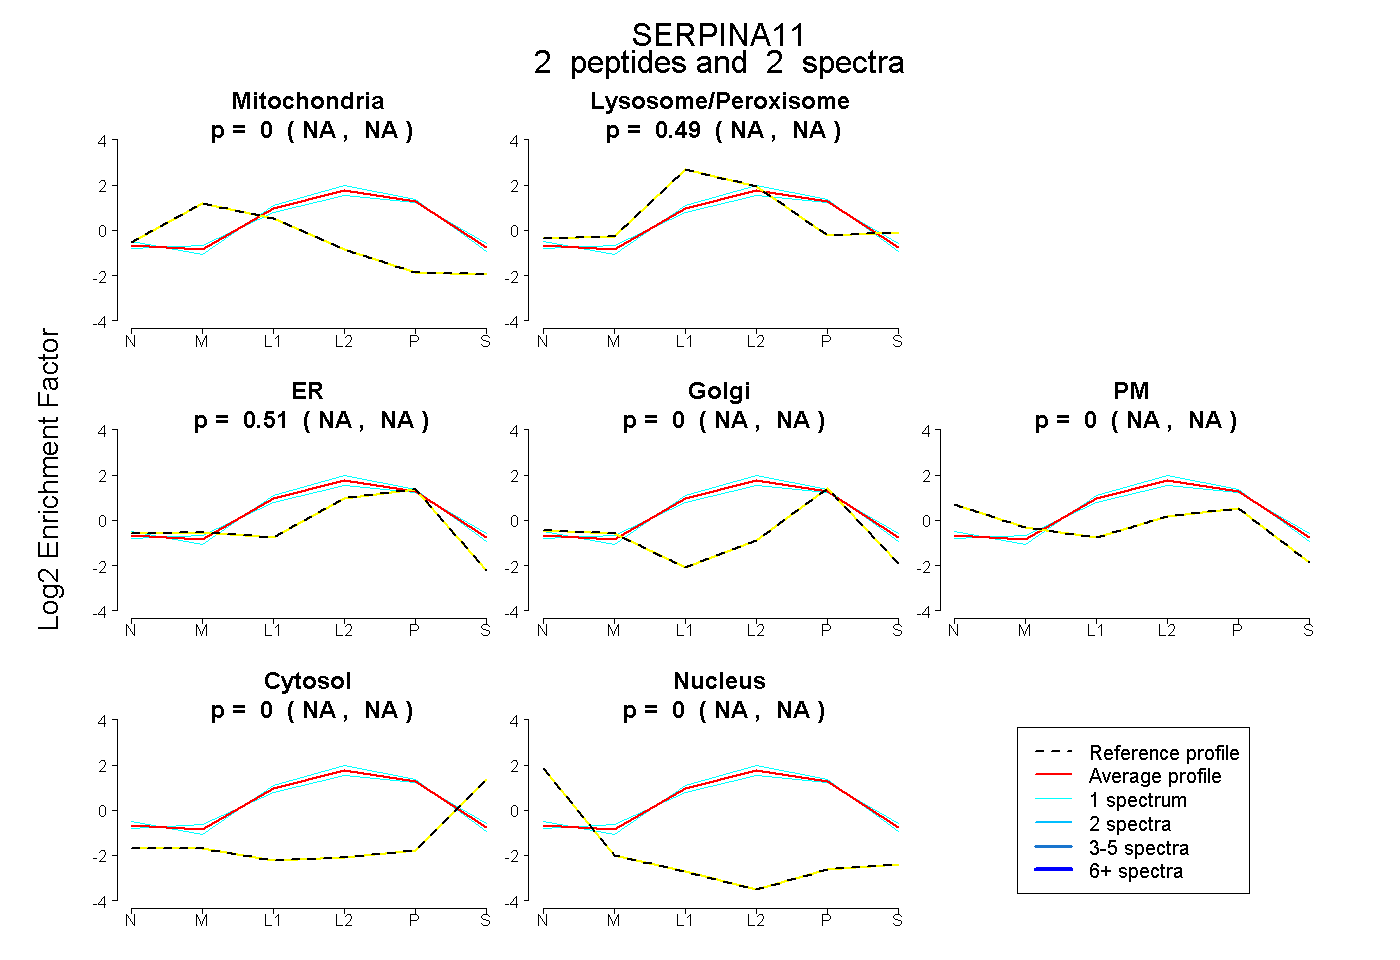
NA | NA
NA | NA
NA | NA
NA | NA
NA | NA
NA | NA
NA | NA
7peptides
spectra
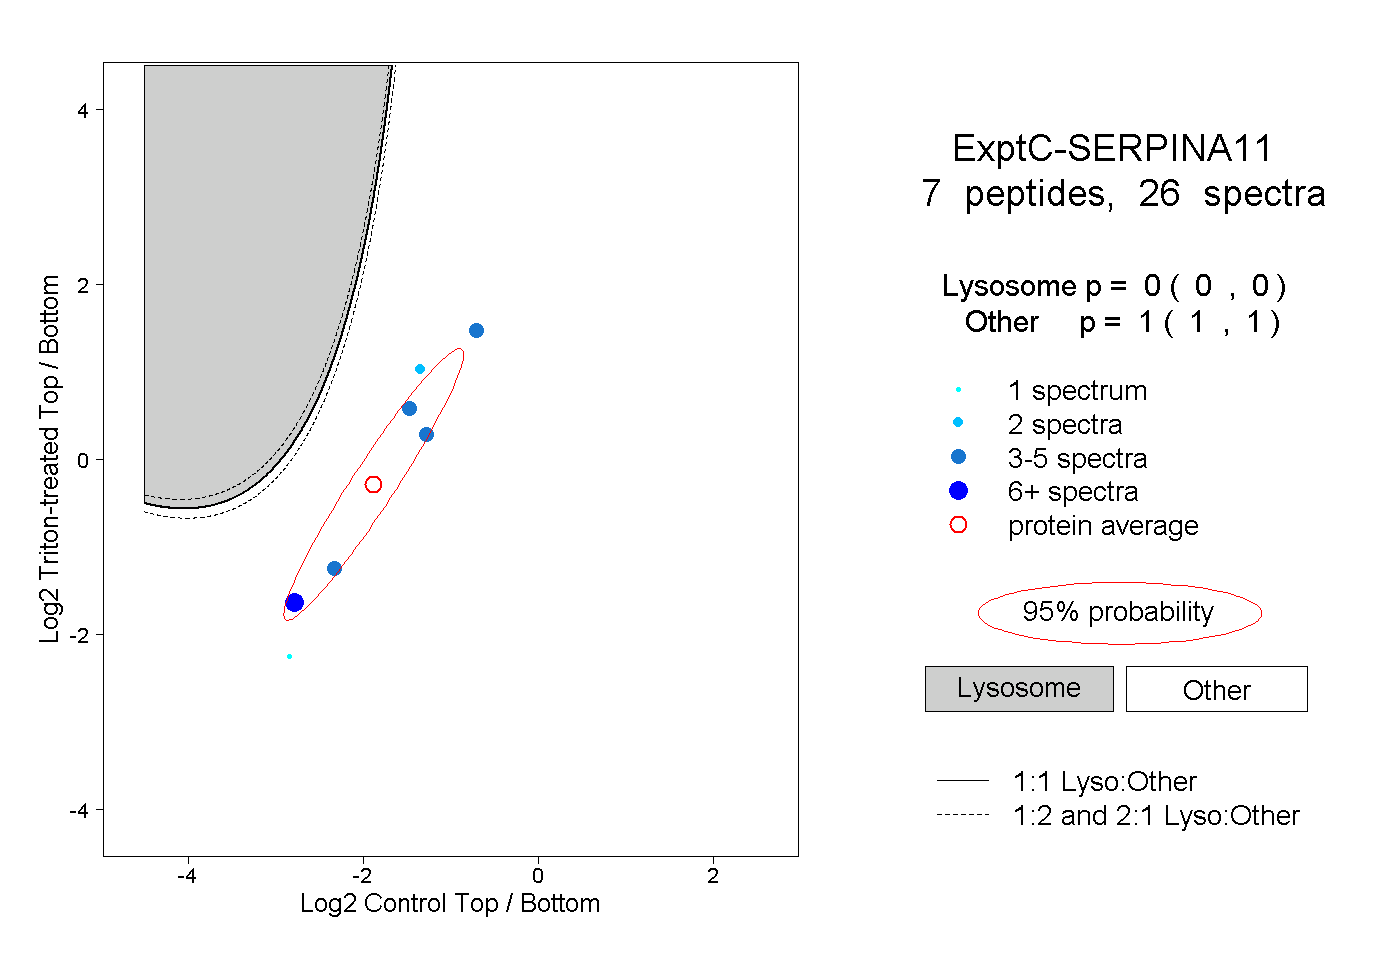
0.000 | 0.000
1.000 | 1.000