 4
4peptides
spectra
0.000 | 0.000
0.775 | 0.816
0.000 | 0.000
0.024 | 0.102
0.073 | 0.159
0.000 | 0.049
0.000 | 0.000
0.000 | 0.000
| Plot | Mito | Lyso | Perox | ER | Golgi | PM | Cytosol | Nucleus | |||||
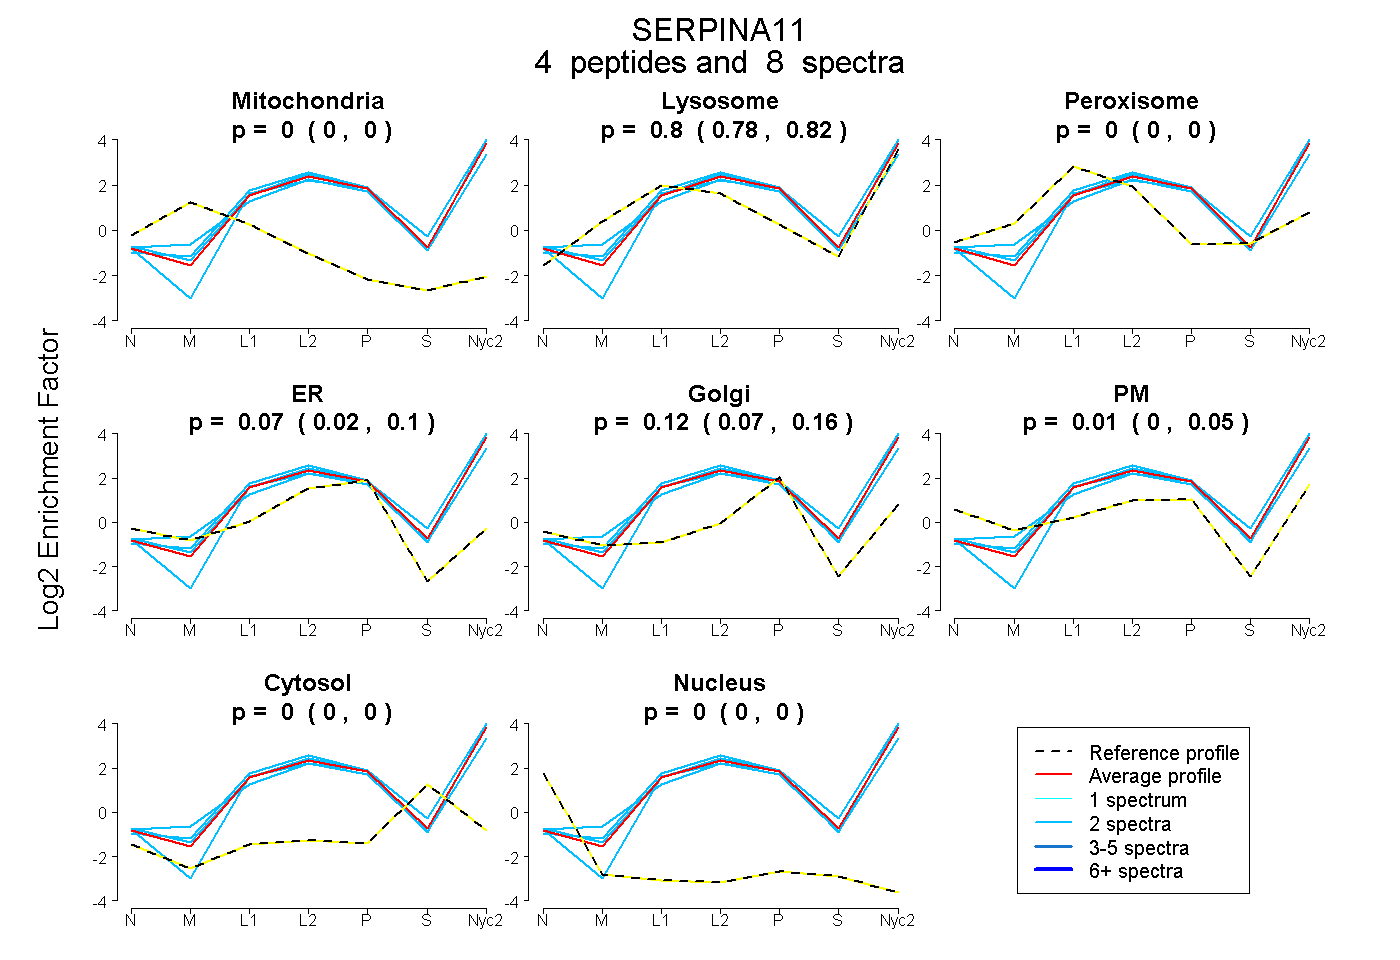
| Expt A |
4 peptides |
8 spectra |
|
0.000 0.000 | 0.000 |
0.799 0.775 | 0.816 |
0.000 0.000 | 0.000 |
0.065 0.024 | 0.102 |
0.123 0.073 | 0.159 |
0.012 0.000 | 0.049 |
0.000 0.000 | 0.000 |
0.000 0.000 | 0.000 |
| 2 spectra, VTPTITNFALR | 0.000 | 0.864 | 0.000 | 0.128 | 0.008 | 0.000 | 0.000 | 0.000 | ||
| 2 spectra, MQQVEAALQPETLR | 0.000 | 0.730 | 0.000 | 0.137 | 0.060 | 0.072 | 0.000 | 0.000 | ||
| 2 spectra, QLKPQQR | 0.000 | 0.784 | 0.000 | 0.042 | 0.042 | 0.132 | 0.000 | 0.000 | ||
| 2 spectra, LGHSLFLDR | 0.000 | 0.761 | 0.000 | 0.000 | 0.201 | 0.000 | 0.038 | 0.000 |
| Plot | Mito | Lyso or Perox | ER | Golgi | PM | Cytosol | Nucleus | ||||||
| Expt B |
2 peptides |
2 spectra |
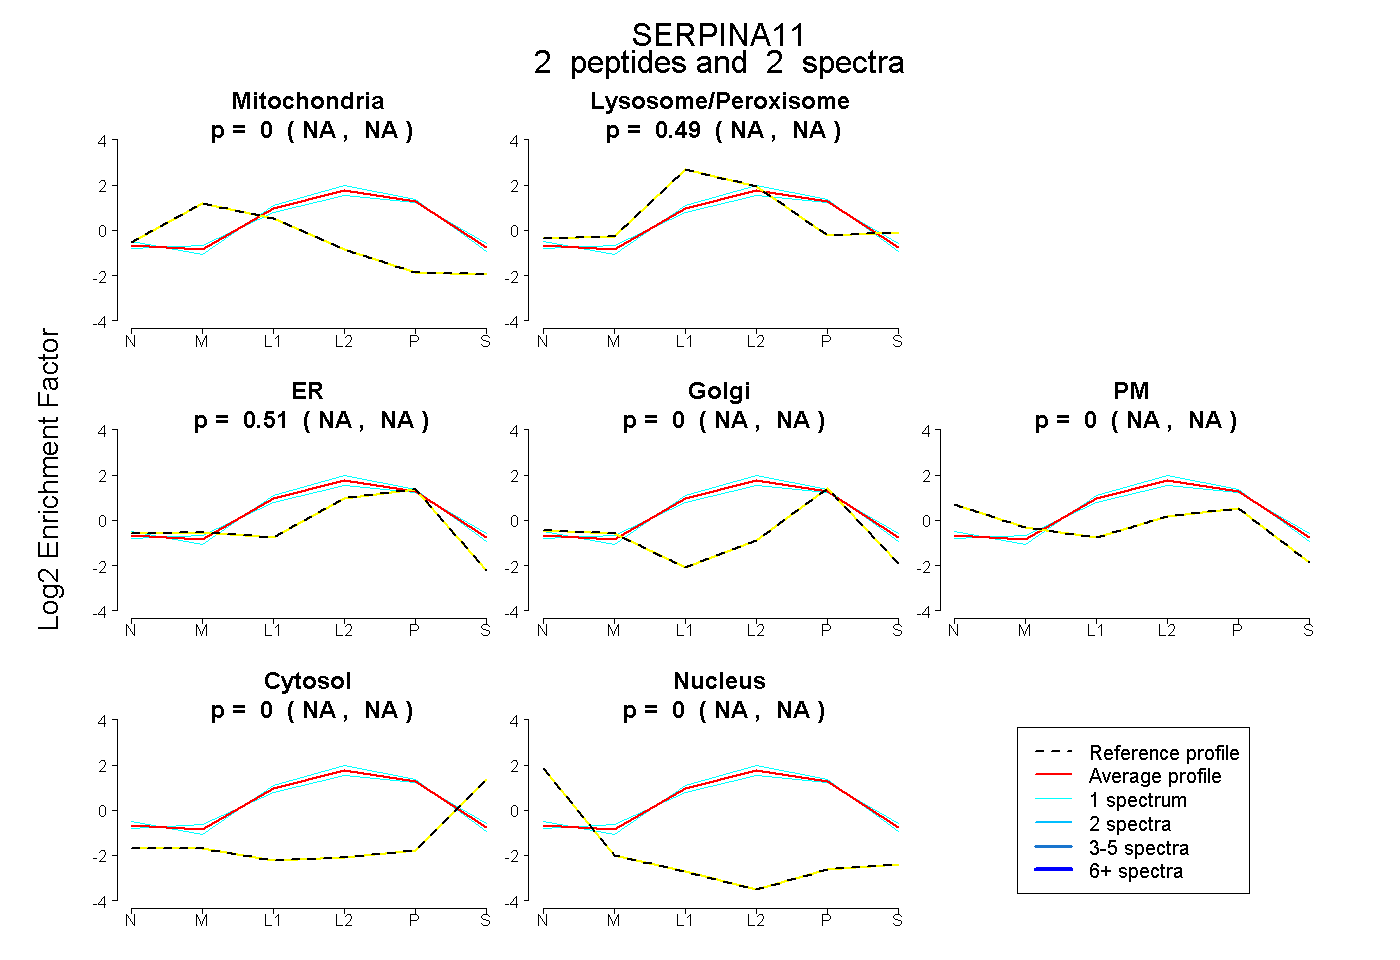 |
0.000 NA | NA |
0.489 NA | NA |
0.511 NA | NA |
0.000 NA | NA |
0.000 NA | NA |
0.000 NA | NA |
0.000 NA | NA |
|||
| Plot | Lyso | Other | |||||||||||
| Expt C |
7 peptides |
26 spectra |
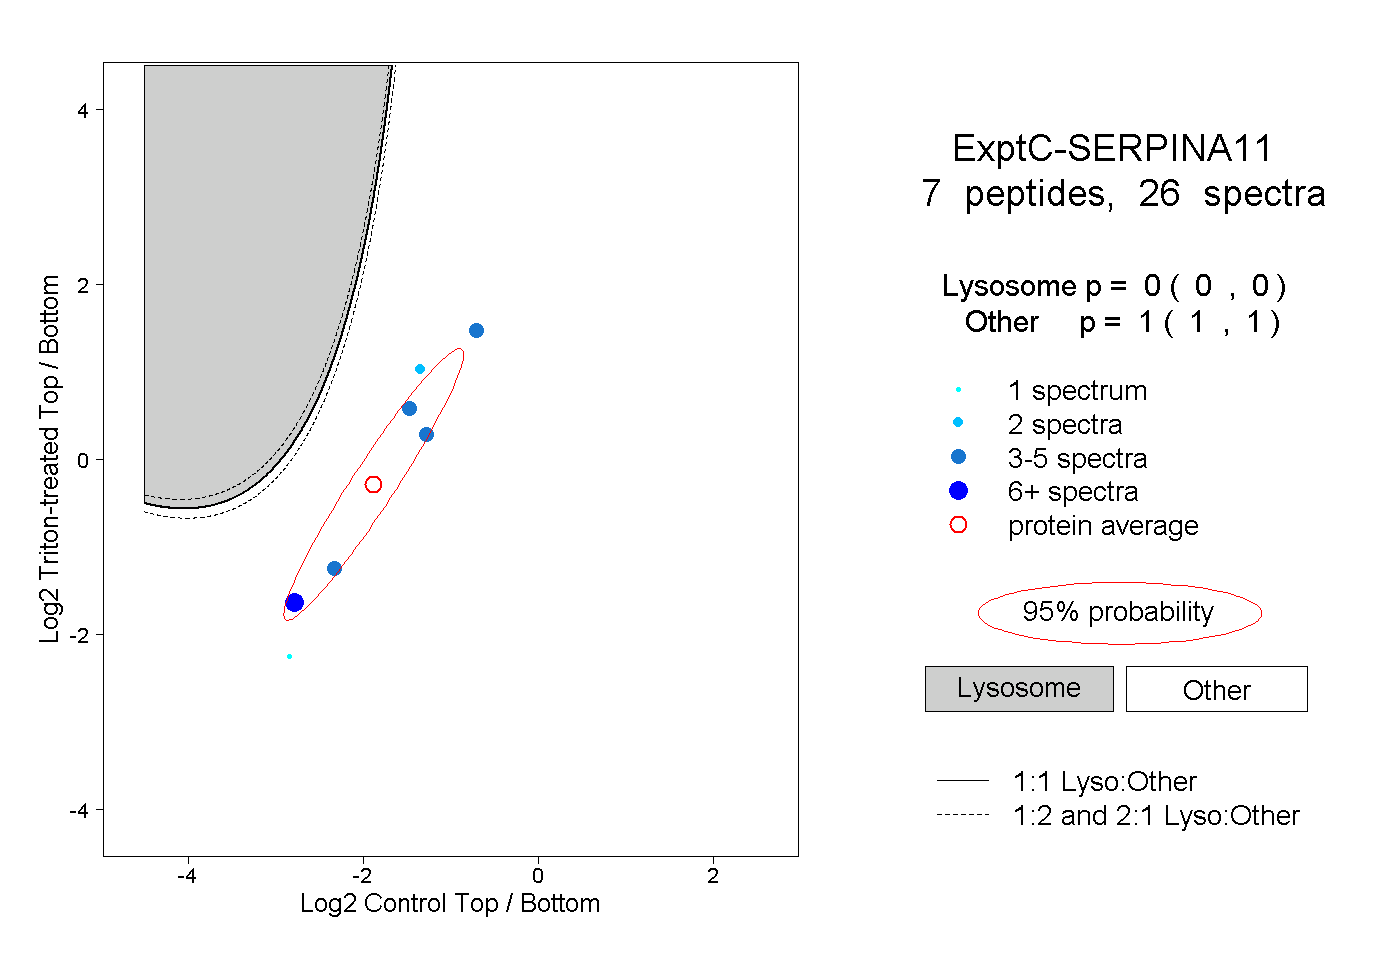 |
0.000 0.000 | 0.000 |
1.000 1.000 | 1.000 |