 12
12peptides
spectra
0.000 | 0.000
1.000 | 1.000
0.000 | 0.000
0.000 | 0.000
0.000 | 0.000
0.000 | 0.000
0.000 | 0.000
0.000 | 0.000
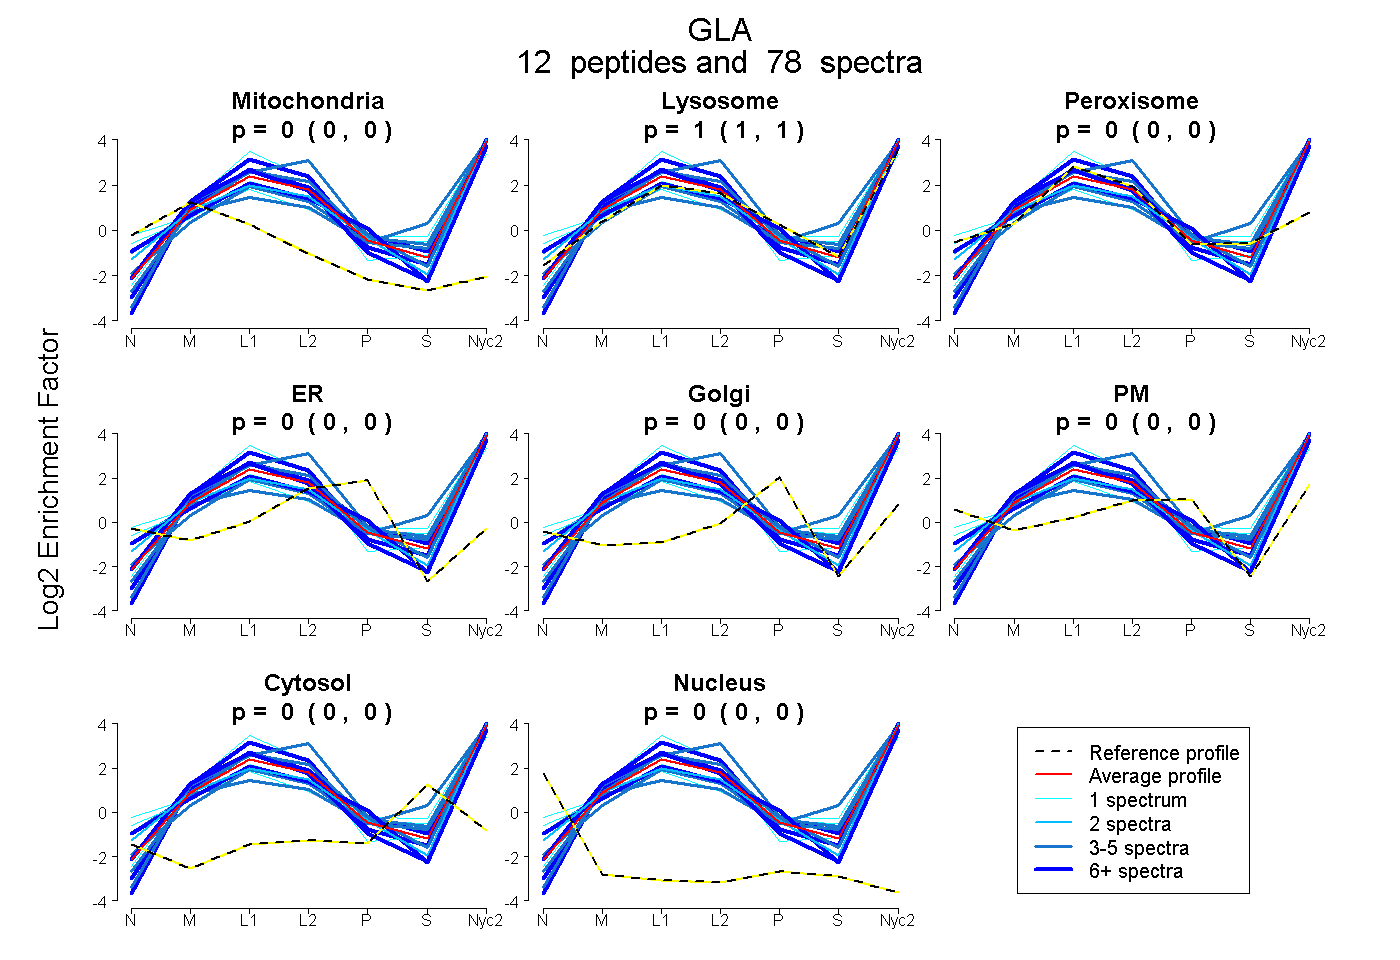
| Plot | Mito | Lyso | Perox | ER | Golgi | PM | Cytosol | Nucleus | |||||
| Expt A |
12 peptides |
78 spectra |
|
0.000 0.000 | 0.000 |
1.000 1.000 | 1.000 |
0.000 0.000 | 0.000 |
0.000 0.000 | 0.000 |
0.000 0.000 | 0.000 |
0.000 0.000 | 0.000 |
0.000 0.000 | 0.000 |
0.000 0.000 | 0.000 |
| 8 spectra, SILAWTVTHQK | 0.014 | 0.986 | 0.000 | 0.000 | 0.000 | 0.000 | 0.000 | 0.000 | ||
| 25 spectra, INPSGTVLLR | 0.000 | 1.000 | 0.000 | 0.000 | 0.000 | 0.000 | 0.000 | 0.000 | ||
| 5 spectra, NLQEIGGPR | 0.000 | 1.000 | 0.000 | 0.000 | 0.000 | 0.000 | 0.000 | 0.000 | ||
| 5 spectra, HLANYVHSK | 0.040 | 0.922 | 0.000 | 0.000 | 0.000 | 0.000 | 0.023 | 0.015 | ||
| 8 spectra, TPTMGWLHWER | 0.010 | 0.856 | 0.000 | 0.000 | 0.000 | 0.134 | 0.000 | 0.000 | ||
| 4 spectra, QISSQAK | 0.000 | 0.920 | 0.000 | 0.000 | 0.000 | 0.000 | 0.080 | 0.000 | ||
| 1 spectrum, LGIYADVGK | 0.000 | 0.928 | 0.072 | 0.000 | 0.000 | 0.000 | 0.000 | 0.000 | ||
| 1 spectrum, DAGYEYLCIDDCWMAPER | 0.000 | 0.935 | 0.065 | 0.000 | 0.000 | 0.000 | 0.000 | 0.000 | ||
| 4 spectra, QGYCFR | 0.000 | 1.000 | 0.000 | 0.000 | 0.000 | 0.000 | 0.000 | 0.000 | ||
| 1 spectrum, GLACNPGCIITQILPEK | 0.000 | 0.815 | 0.128 | 0.000 | 0.000 | 0.000 | 0.000 | 0.057 | ||
| 2 spectra, VHLGFYEWPLTLK | 0.029 | 0.971 | 0.000 | 0.000 | 0.000 | 0.000 | 0.000 | 0.000 | ||
| 14 spectra, FYTIQISSLGR | 0.000 | 1.000 | 0.000 | 0.000 | 0.000 | 0.000 | 0.000 | 0.000 |
| Plot | Mito | Lyso or Perox | ER | Golgi | PM | Cytosol | Nucleus | ||||||
| Expt B |
10 peptides |
28 spectra |
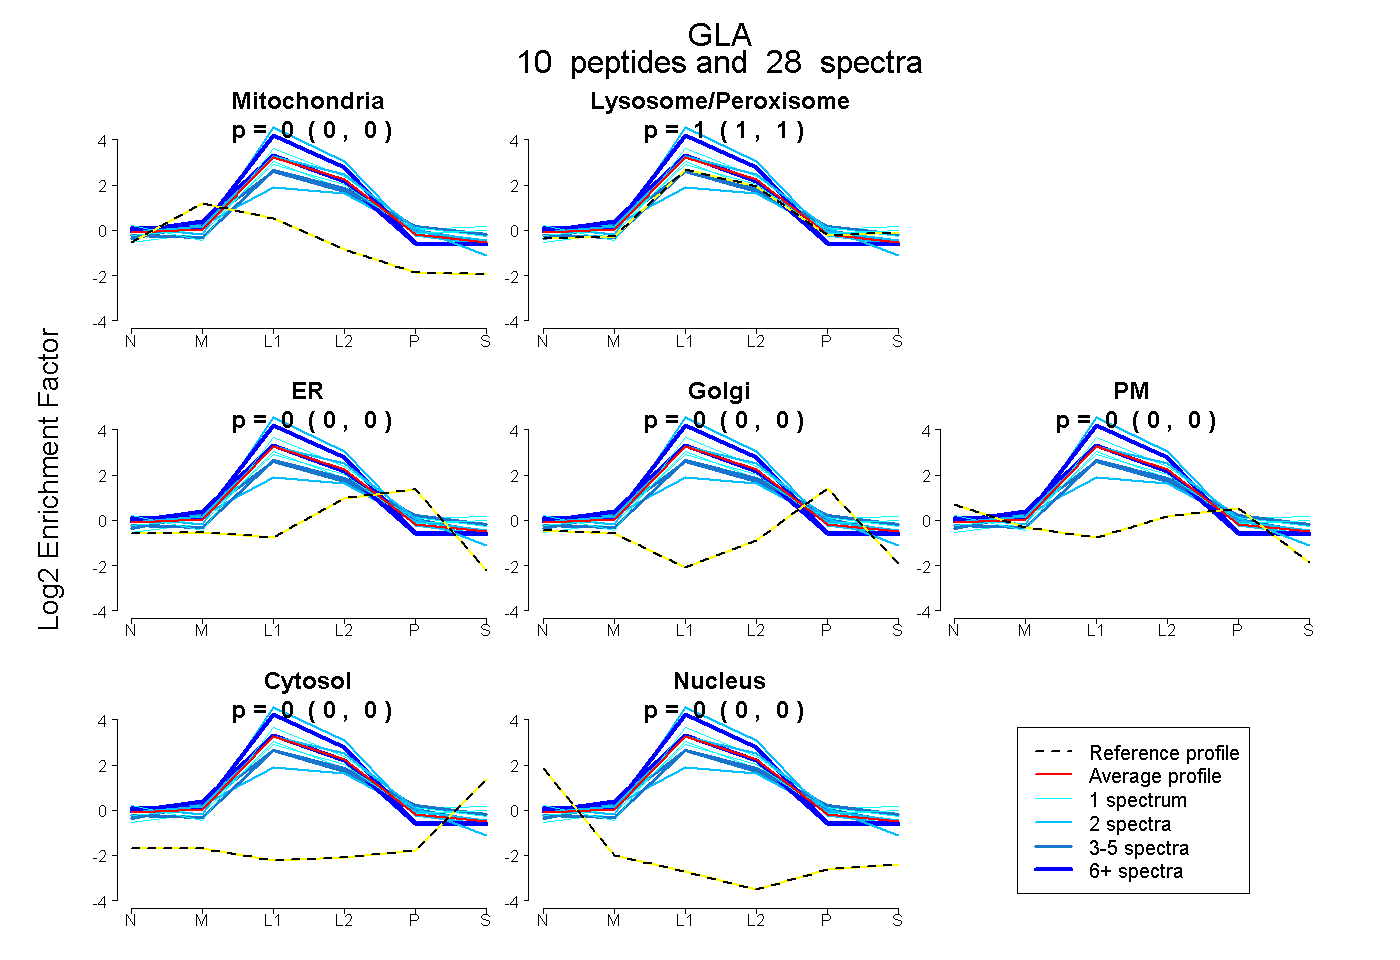 |
0.000 0.000 | 0.000 |
1.000 1.000 | 1.000 |
0.000 0.000 | 0.000 |
0.000 0.000 | 0.000 |
0.000 0.000 | 0.000 |
0.000 0.000 | 0.000 |
0.000 0.000 | 0.000 |
|||
| Plot | Lyso | Other | |||||||||||
| Expt C |
14 peptides |
269 spectra |
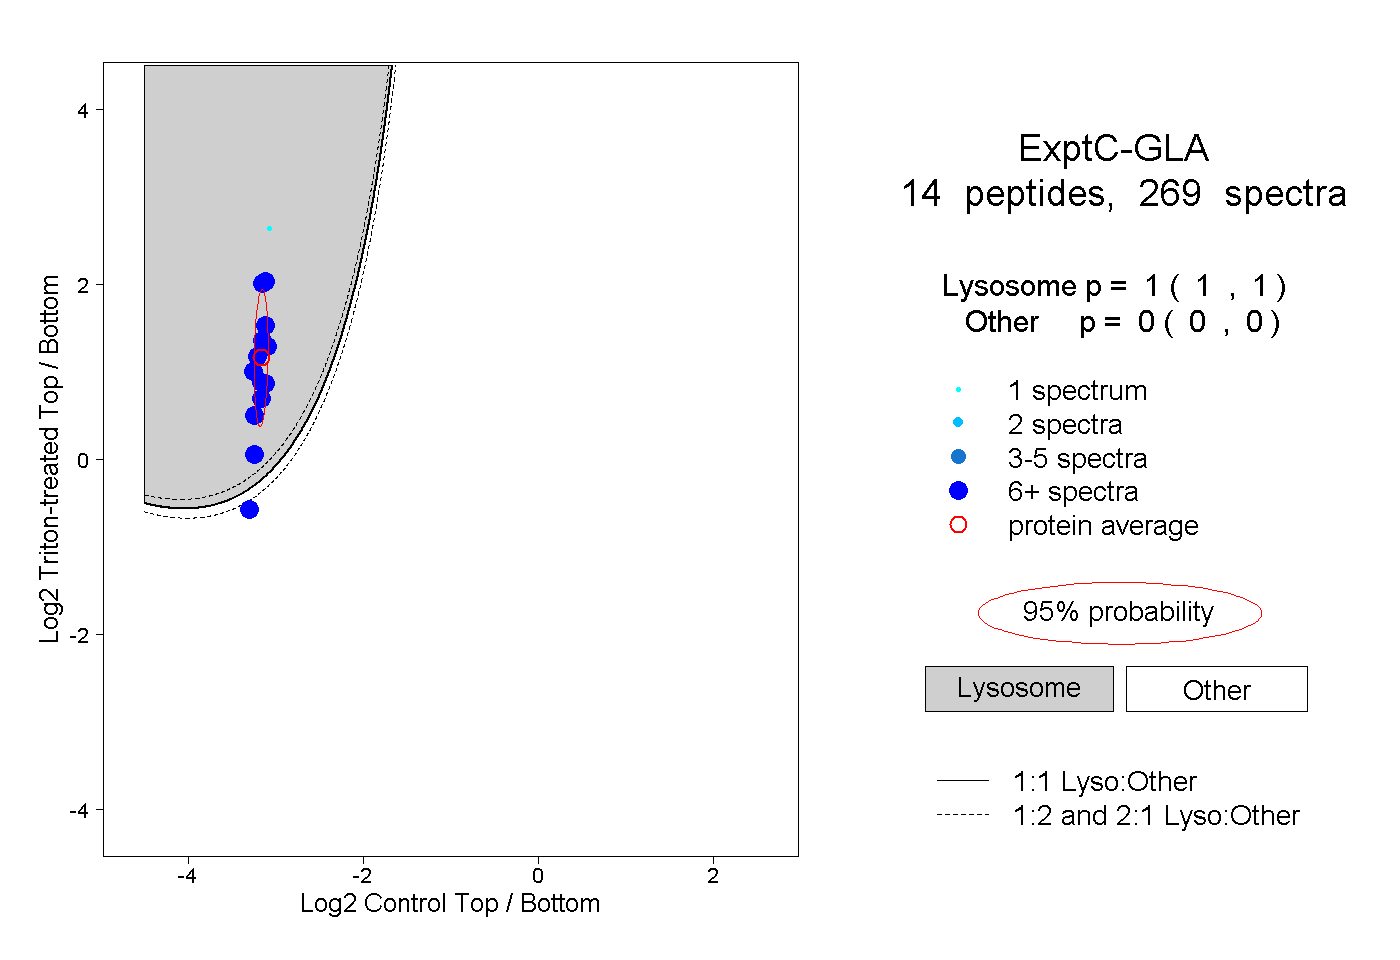 |
1.000 1.000 | 1.000 |
0.000 0.000 | 0.000 |
||||||||
| Plot | Lyso | Other | |||||||||||
| Expt D |
7 peptides |
17 spectra |
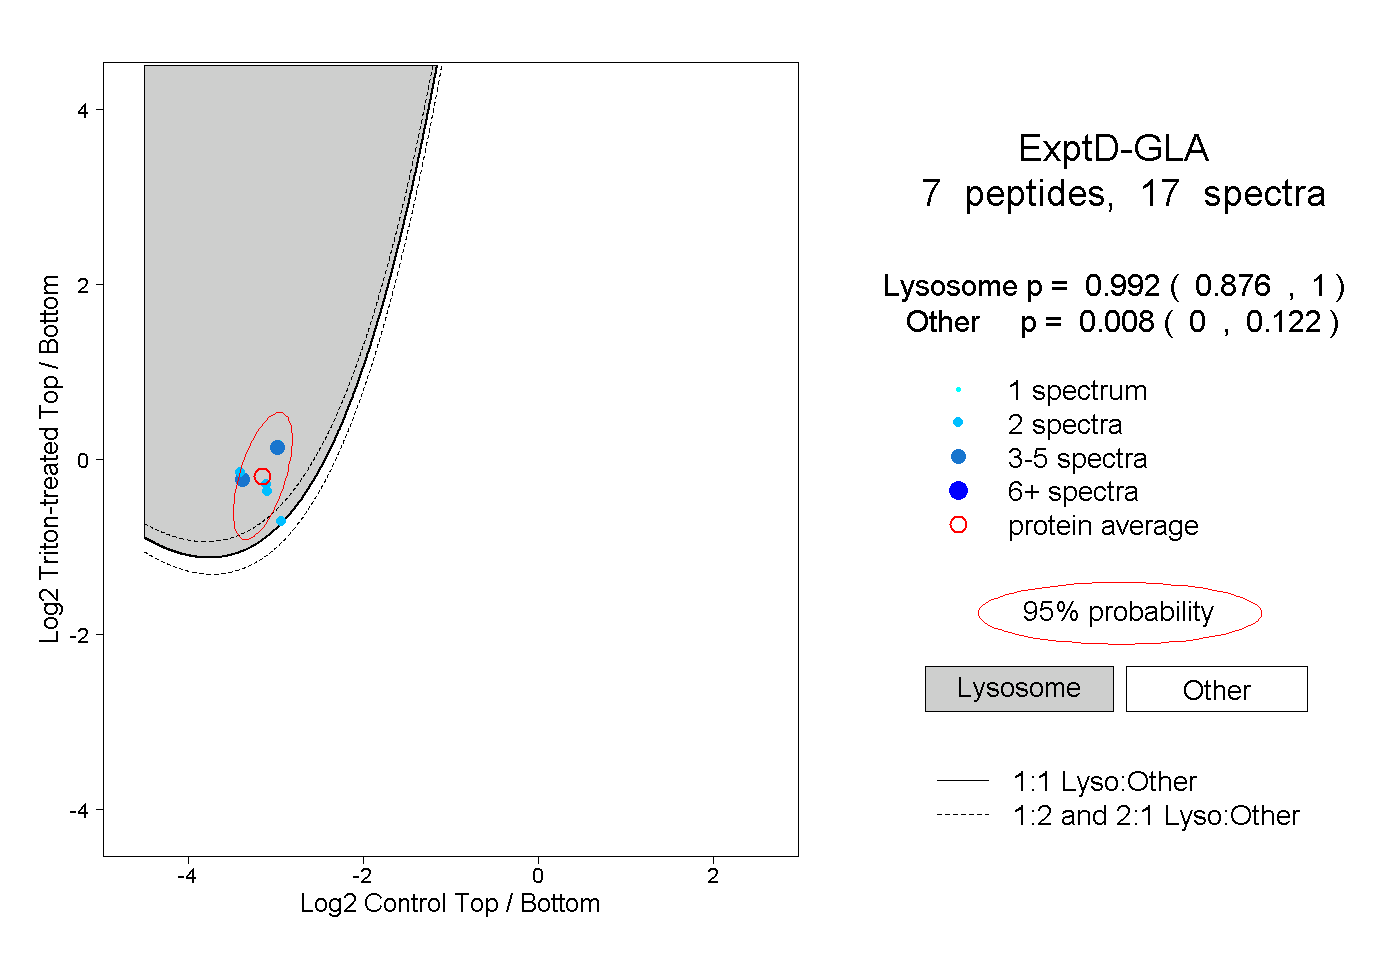 |
0.992 0.876 | 1.000 |
0.008 0.000 | 0.122 |