 5
5peptides
spectra
0.000 | 0.000
0.000 | 0.000
0.000 | 0.097
0.326 | 0.427
0.000 | 0.000
0.000 | 0.039
0.225 | 0.312
0.236 | 0.317
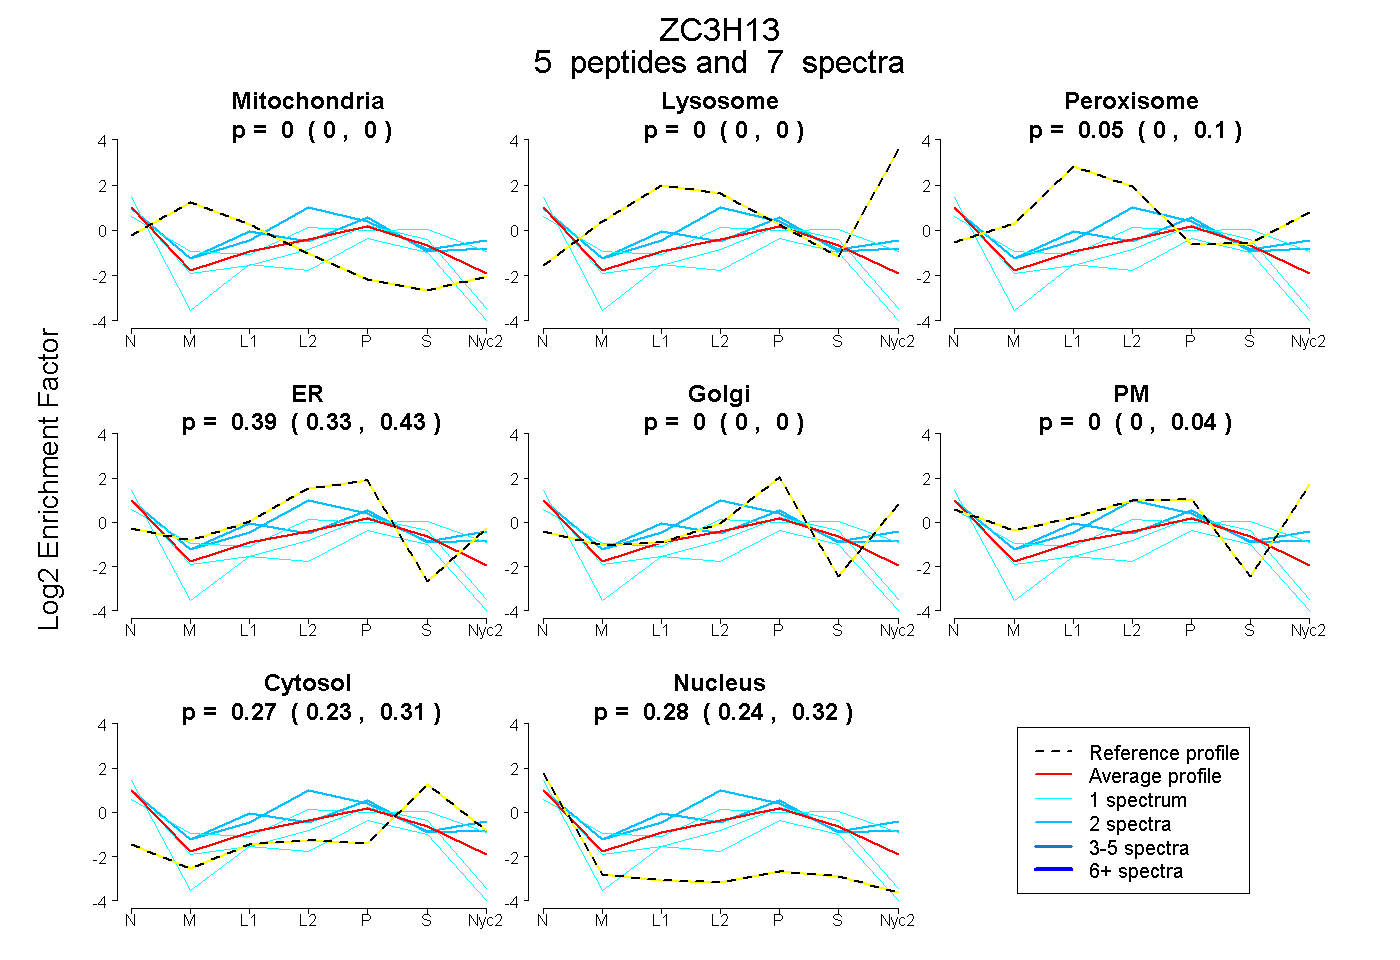
| Plot | Mito | Lyso | Perox | ER | Golgi | PM | Cytosol | Nucleus | |||||
| Expt A |
5 peptides |
7 spectra |
|
0.000 0.000 | 0.000 |
0.000 0.000 | 0.000 |
0.053 0.000 | 0.097 |
0.392 0.326 | 0.427 |
0.000 0.000 | 0.000 |
0.000 0.000 | 0.039 |
0.273 0.225 | 0.312 |
0.282 0.236 | 0.317 |
| 2 spectra, DVHDYR | 0.000 | 0.000 | 0.235 | 0.136 | 0.210 | 0.065 | 0.127 | 0.227 | ||
| 1 spectrum, FIHGPSPR | 0.000 | 0.000 | 0.099 | 0.233 | 0.000 | 0.138 | 0.405 | 0.124 | ||
| 1 spectrum, EEDVGIER | 0.000 | 0.000 | 0.000 | 0.167 | 0.000 | 0.000 | 0.220 | 0.612 | ||
| 1 spectrum, LVDQK | 0.000 | 0.000 | 0.000 | 0.315 | 0.000 | 0.000 | 0.286 | 0.399 | ||
| 2 spectra, EDVHVR | 0.000 | 0.000 | 0.135 | 0.327 | 0.000 | 0.227 | 0.193 | 0.119 |