 2
2peptides
spectra
0.000 | 0.203
0.000 | 0.190
0.000 | 0.129
0.000 | 0.074
0.000 | 0.076
0.000 | 0.186
0.661 | 0.773
0.000 | 0.009
2peptides
spectra
NA | NA
NA | NA
| Plot | Mito | Lyso | Perox | ER | Golgi | PM | Cytosol | Nucleus | |||||
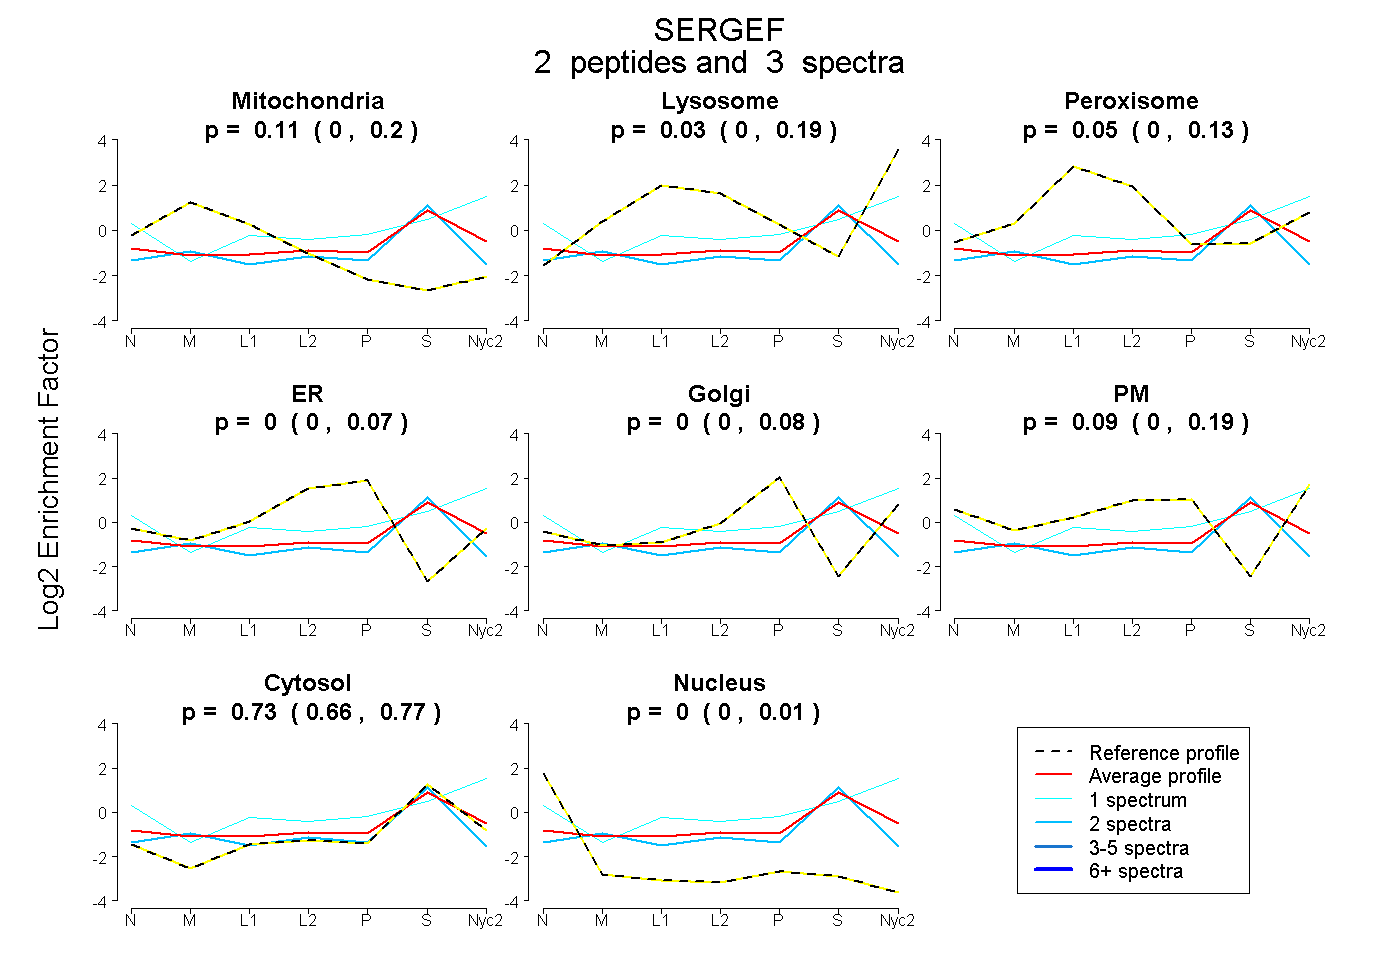
| Expt A |
2 peptides |
3 spectra |
|
0.108 0.000 | 0.203 |
0.026 0.000 | 0.190 |
0.046 0.000 | 0.129 |
0.000 0.000 | 0.074 |
0.000 0.000 | 0.076 |
0.088 0.000 | 0.186 |
0.732 0.661 | 0.773 |
0.000 0.000 | 0.009 |
||
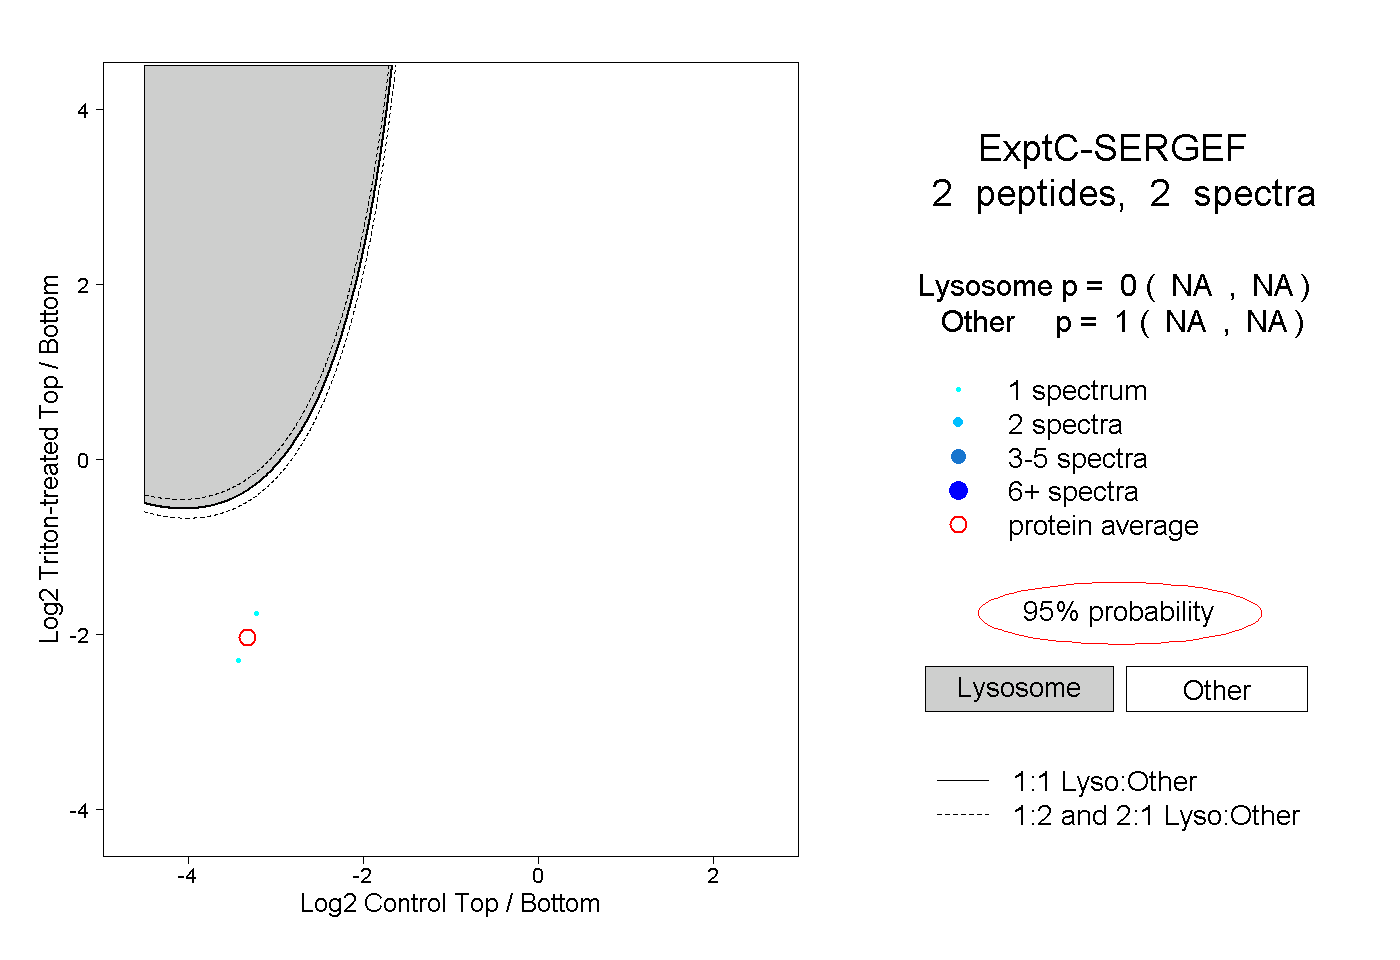
| Plot | Lyso | Other | |||||||||||
| Expt C |
2 peptides |
2 spectra |
|
0.000 NA | NA |
1.000 NA | NA |