 8
8peptides
spectra
0.000 | 0.001
0.000 | 0.000
0.000 | 0.013
0.093 | 0.182
0.141 | 0.241
0.000 | 0.017
0.629 | 0.668
0.000 | 0.013
1peptide
spectrum
NA | NA
NA | NA
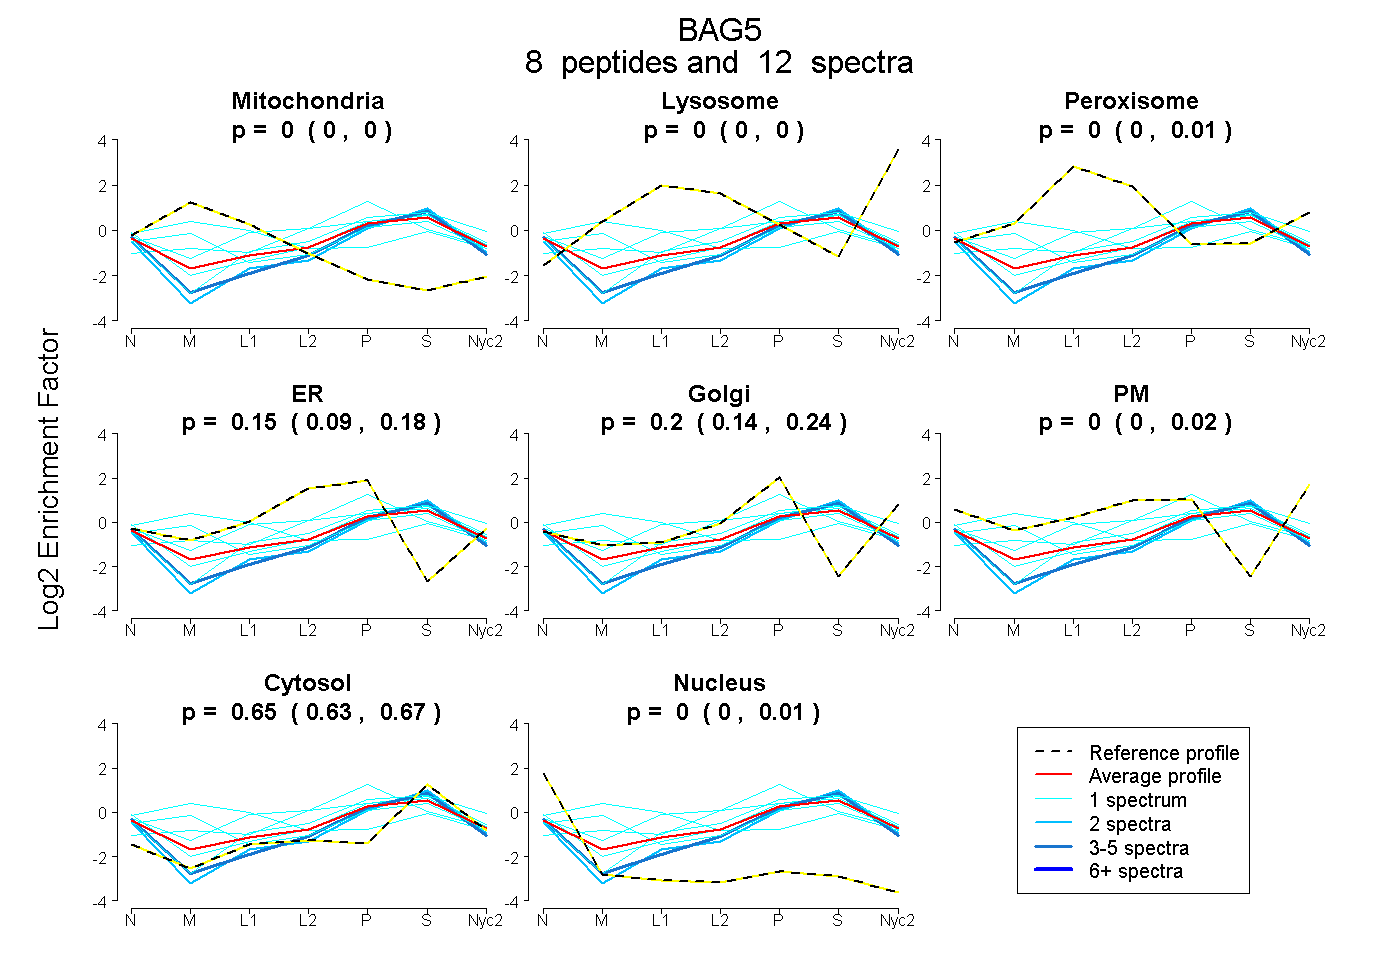
| Plot | Mito | Lyso | Perox | ER | Golgi | PM | Cytosol | Nucleus | |||||
| Expt A |
8 peptides |
12 spectra |
|
0.000 0.000 | 0.001 |
0.000 0.000 | 0.000 |
0.000 0.000 | 0.013 |
0.148 0.093 | 0.182 |
0.198 0.141 | 0.241 |
0.000 0.000 | 0.017 |
0.653 0.629 | 0.668 |
0.001 0.000 | 0.013 |
||
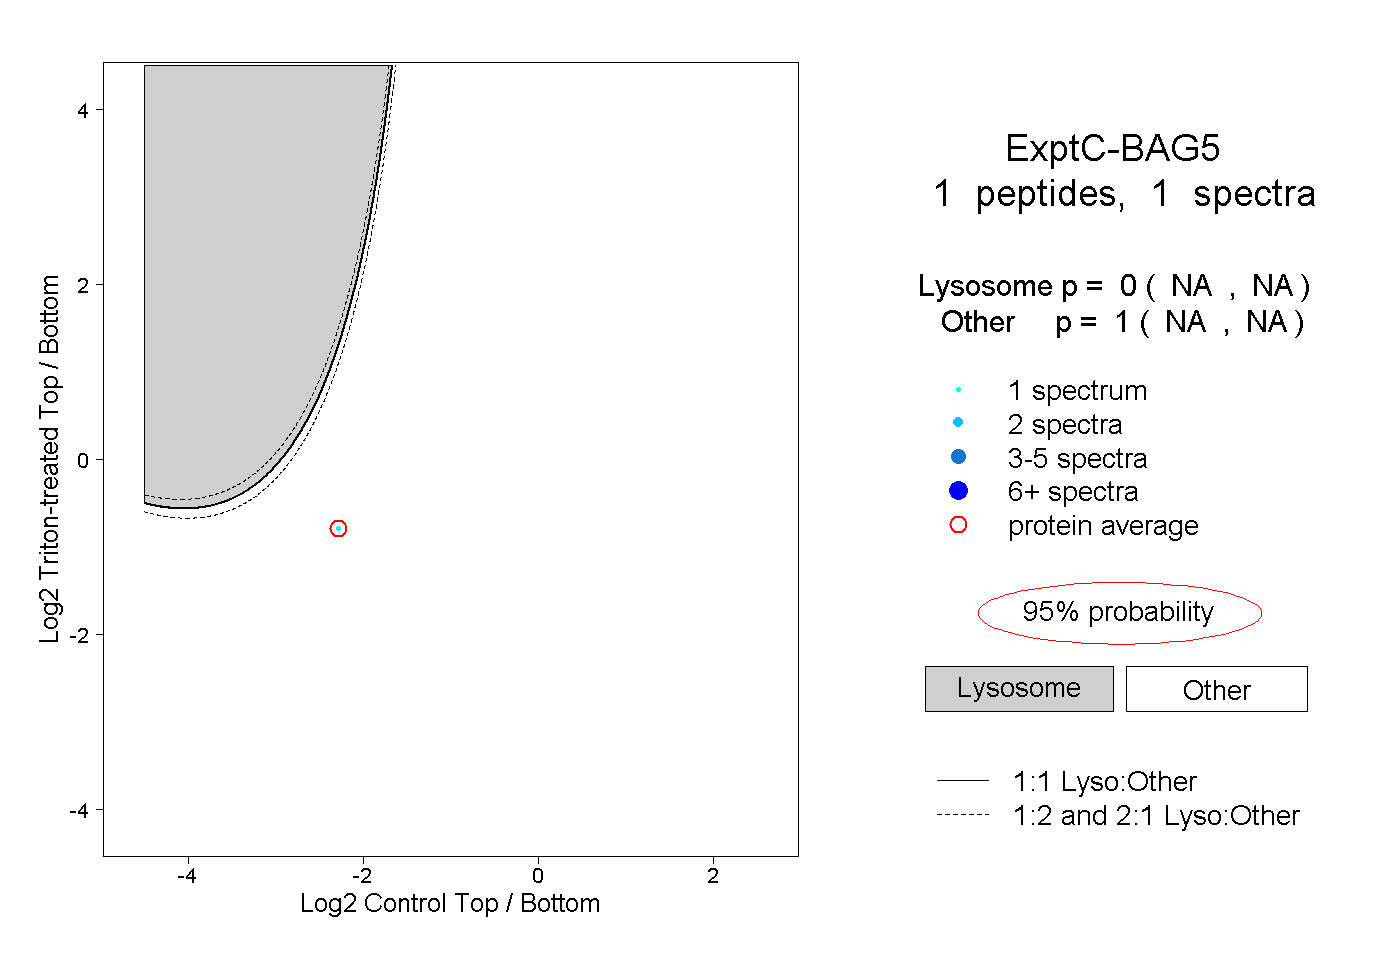
| Plot | Lyso | Other | |||||||||||
| Expt C |
1 peptide |
1 spectrum |
|
0.000 NA | NA |
1.000 NA | NA |