 7
7peptides
spectra

0.000 | 0.000
0.000 | 0.000
0.000 | 0.000
0.080 | 0.151
0.000 | 0.070
0.269 | 0.328
0.533 | 0.553
0.000 | 0.000
3peptides
spectra

0.000 | 0.023
0.330 | 0.474
0.000 | 0.000
0.071 | 0.203
0.014 | 0.258
0.232 | 0.303
0.000 | 0.024
5peptides
spectra
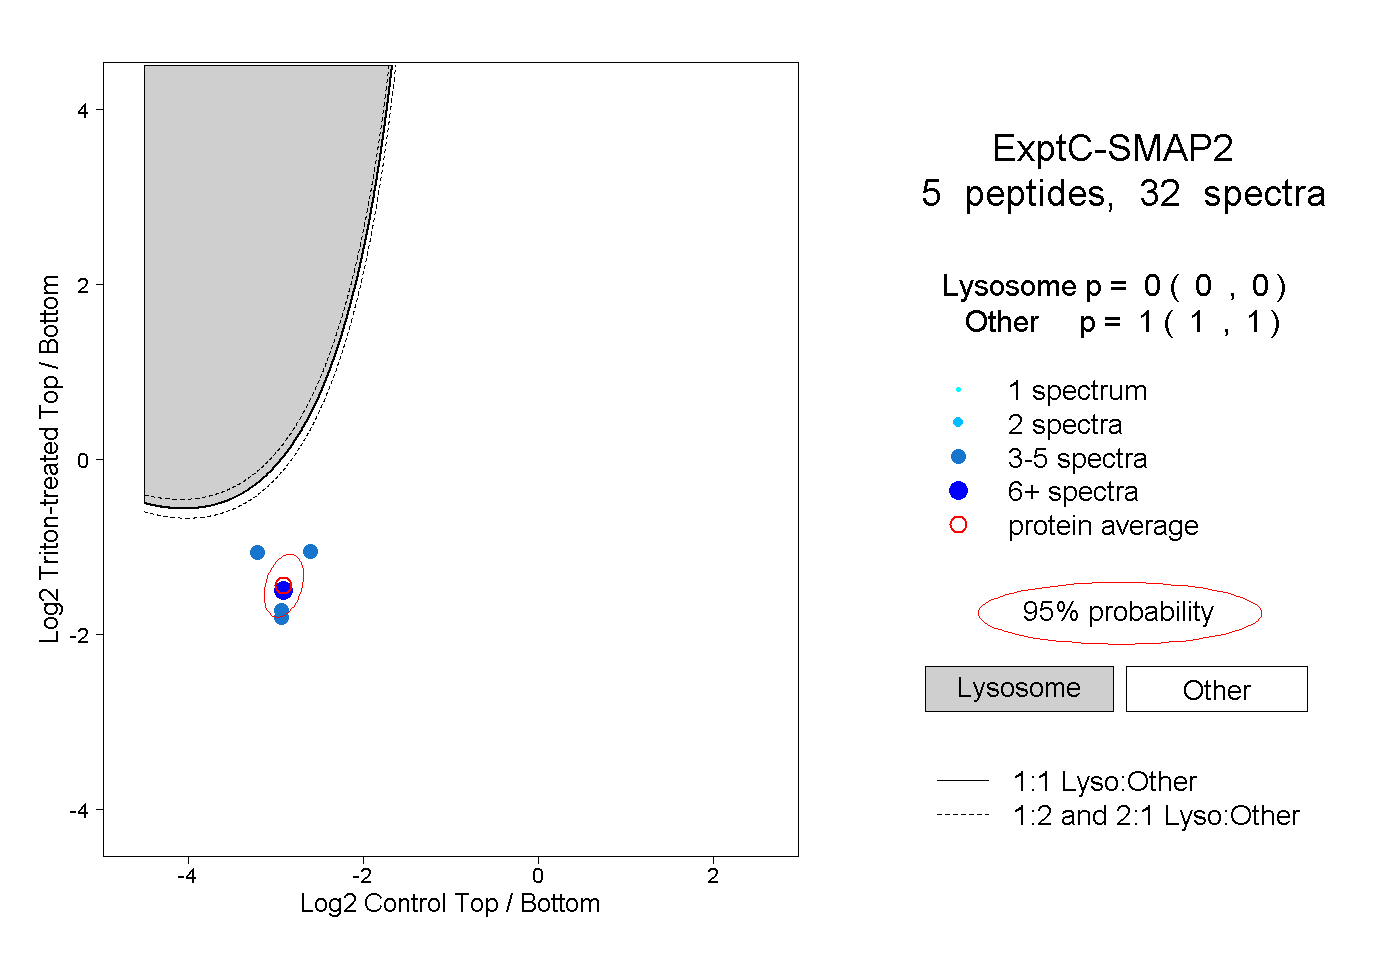
0.000 | 0.000
1.000 | 1.000