 6
6peptides
spectra
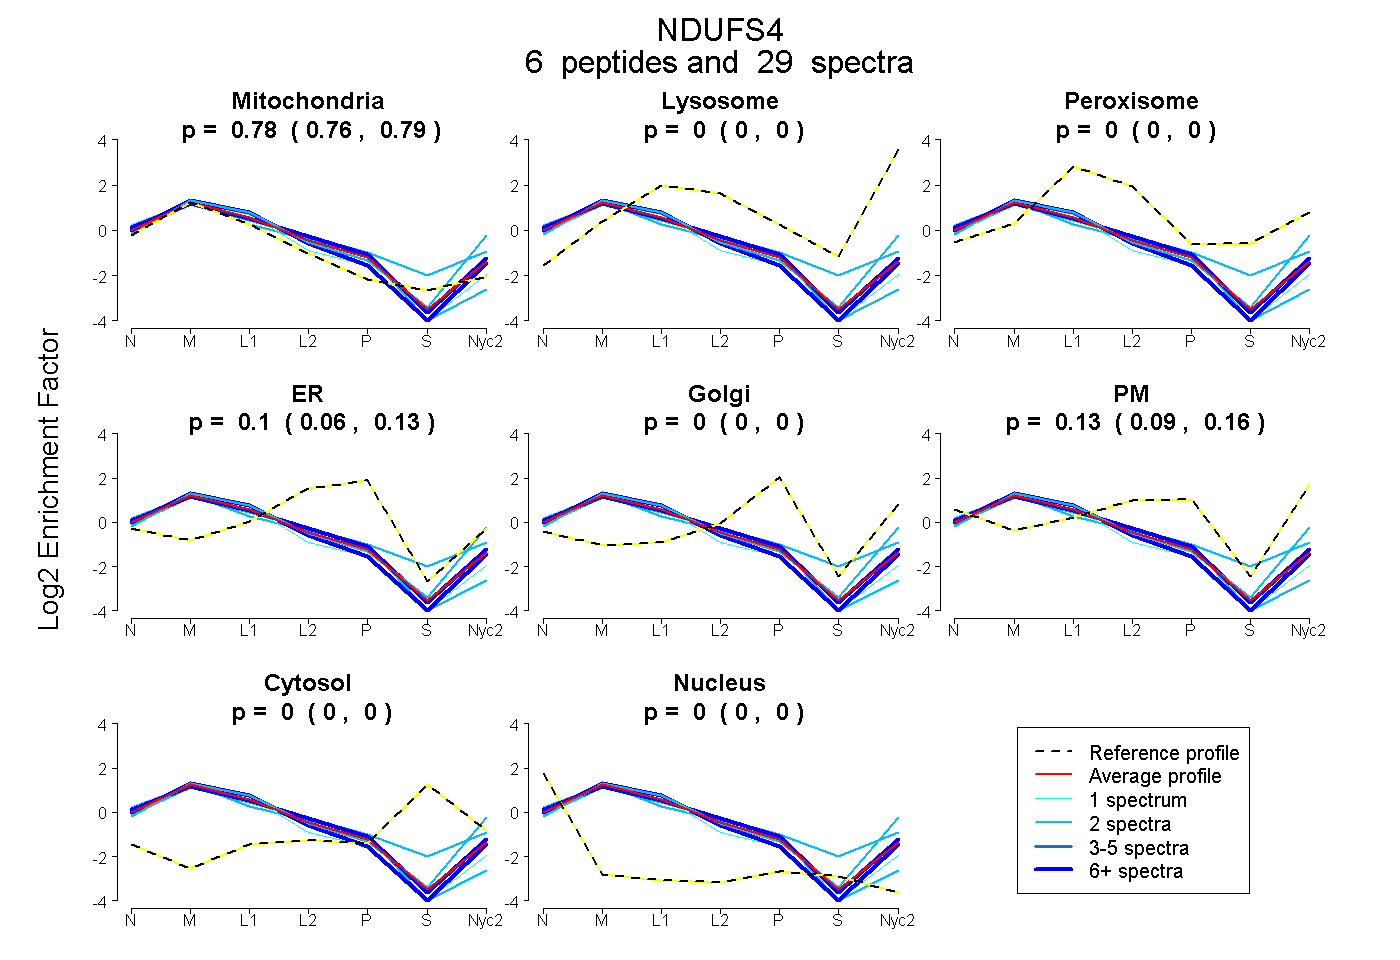
0.764 | 0.786
0.000 | 0.000
0.000 | 0.000
0.062 | 0.126
0.000 | 0.000
0.085 | 0.164
0.000 | 0.000
0.000 | 0.000
| Plot | Mito | Lyso | Perox | ER | Golgi | PM | Cytosol | Nucleus | |||||
| Expt A |
6 peptides |
29 spectra |
|
0.776 0.764 | 0.786 |
0.000 0.000 | 0.000 |
0.000 0.000 | 0.000 |
0.096 0.062 | 0.126 |
0.000 0.000 | 0.000 |
0.128 0.085 | 0.164 |
0.000 0.000 | 0.000 |
0.000 0.000 | 0.000 |
| 1 spectrum, EDAVAFAEK | 0.899 | 0.000 | 0.000 | 0.096 | 0.000 | 0.005 | 0.000 | 0.000 | ||
| 16 spectra, IFVPAR | 0.730 | 0.000 | 0.000 | 0.109 | 0.000 | 0.161 | 0.000 | 0.000 | ||
| 2 spectra, SYGANFSWNK | 0.687 | 0.139 | 0.000 | 0.000 | 0.000 | 0.174 | 0.000 | 0.000 | ||
| 2 spectra, HGWSYDVEGR | 0.640 | 0.006 | 0.153 | 0.000 | 0.087 | 0.114 | 0.000 | 0.000 | ||
| 6 spectra, MEFDTR | 0.844 | 0.000 | 0.000 | 0.025 | 0.000 | 0.131 | 0.000 | 0.000 | ||
| 2 spectra, DTQLITVDEK | 0.829 | 0.000 | 0.000 | 0.171 | 0.000 | 0.000 | 0.000 | 0.000 |
| Plot | Mito | Lyso or Perox | ER | Golgi | PM | Cytosol | Nucleus | ||||||
| Expt B |
4 peptides |
10 spectra |
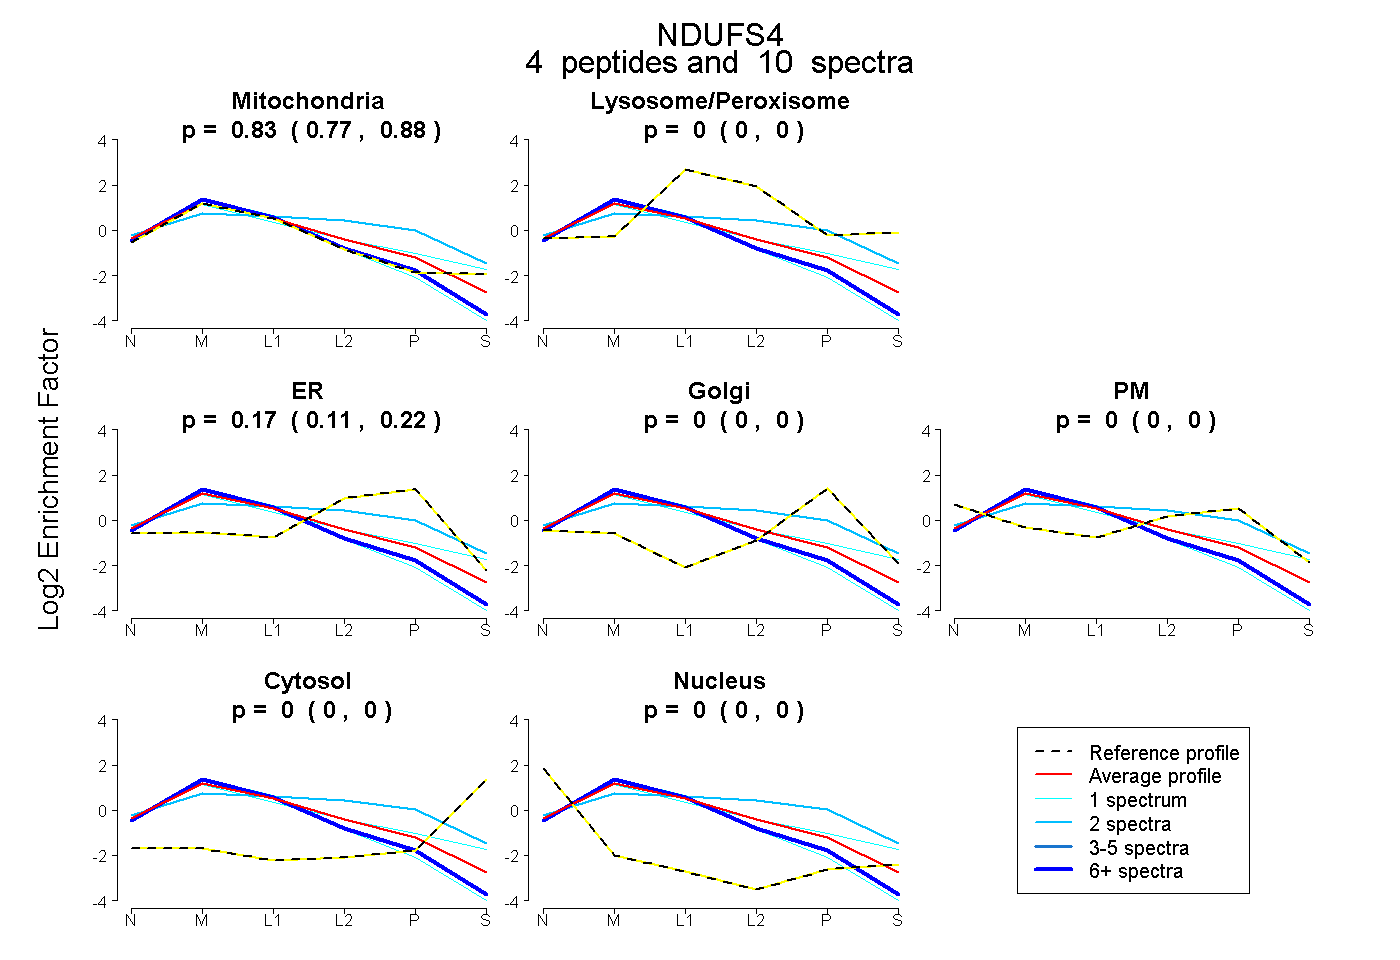 |
0.829 0.771 | 0.877 |
0.000 0.000 | 0.001 |
0.171 0.113 | 0.217 |
0.000 0.000 | 0.000 |
0.000 0.000 | 0.000 |
0.000 0.000 | 0.000 |
0.000 0.000 | 0.000 |
|||
| Plot | Lyso | Other | |||||||||||
| Expt C |
8 peptides |
66 spectra |
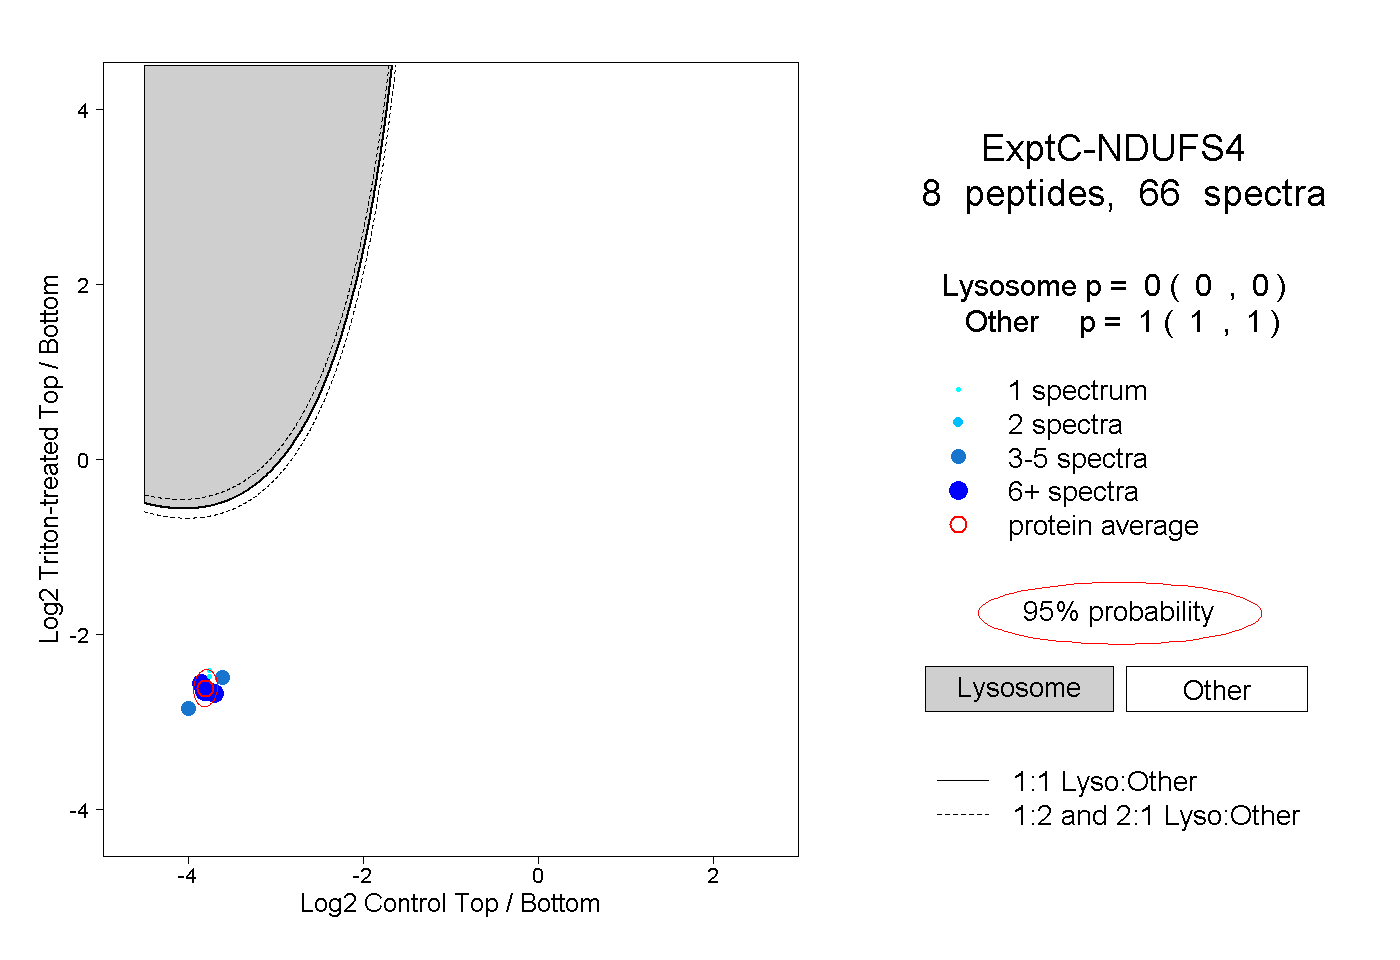 |
0.000 0.000 | 0.000 |
1.000 1.000 | 1.000 |
||||||||
| Plot | Lyso | Other | |||||||||||
| Expt D |
3 peptides |
9 spectra |
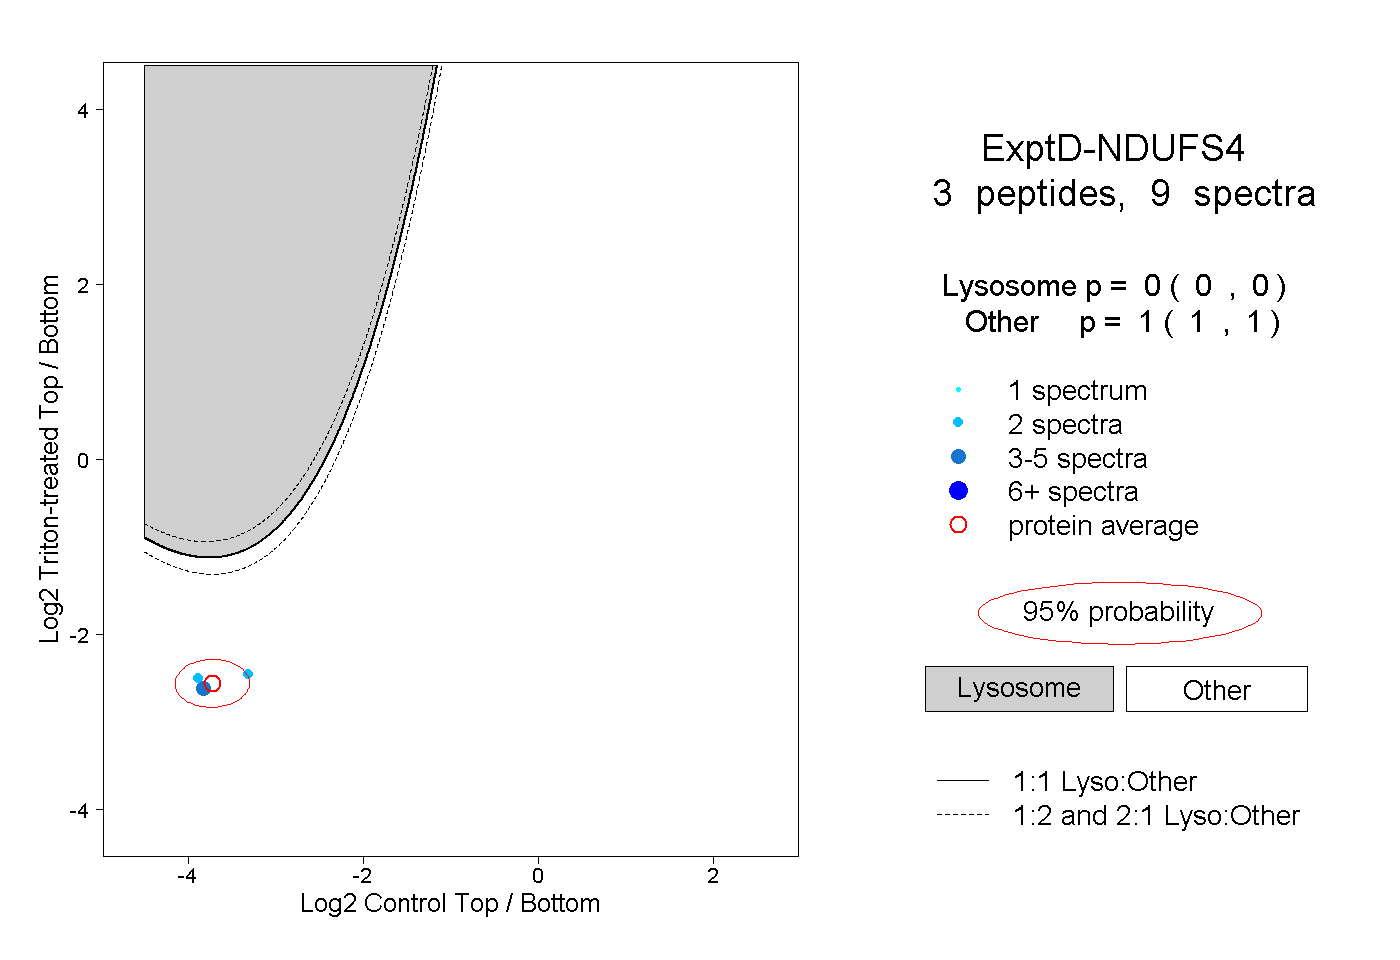 |
0.000 0.000 | 0.000 |
1.000 1.000 | 1.000 |