 9
9peptides
spectra
0.000 | 0.000
0.000 | 0.000
0.000 | 0.000
0.000 | 0.000
0.080 | 0.093
0.000 | 0.000
0.906 | 0.919
0.000 | 0.000
| Plot | Mito | Lyso | Perox | ER | Golgi | PM | Cytosol | Nucleus | |||||
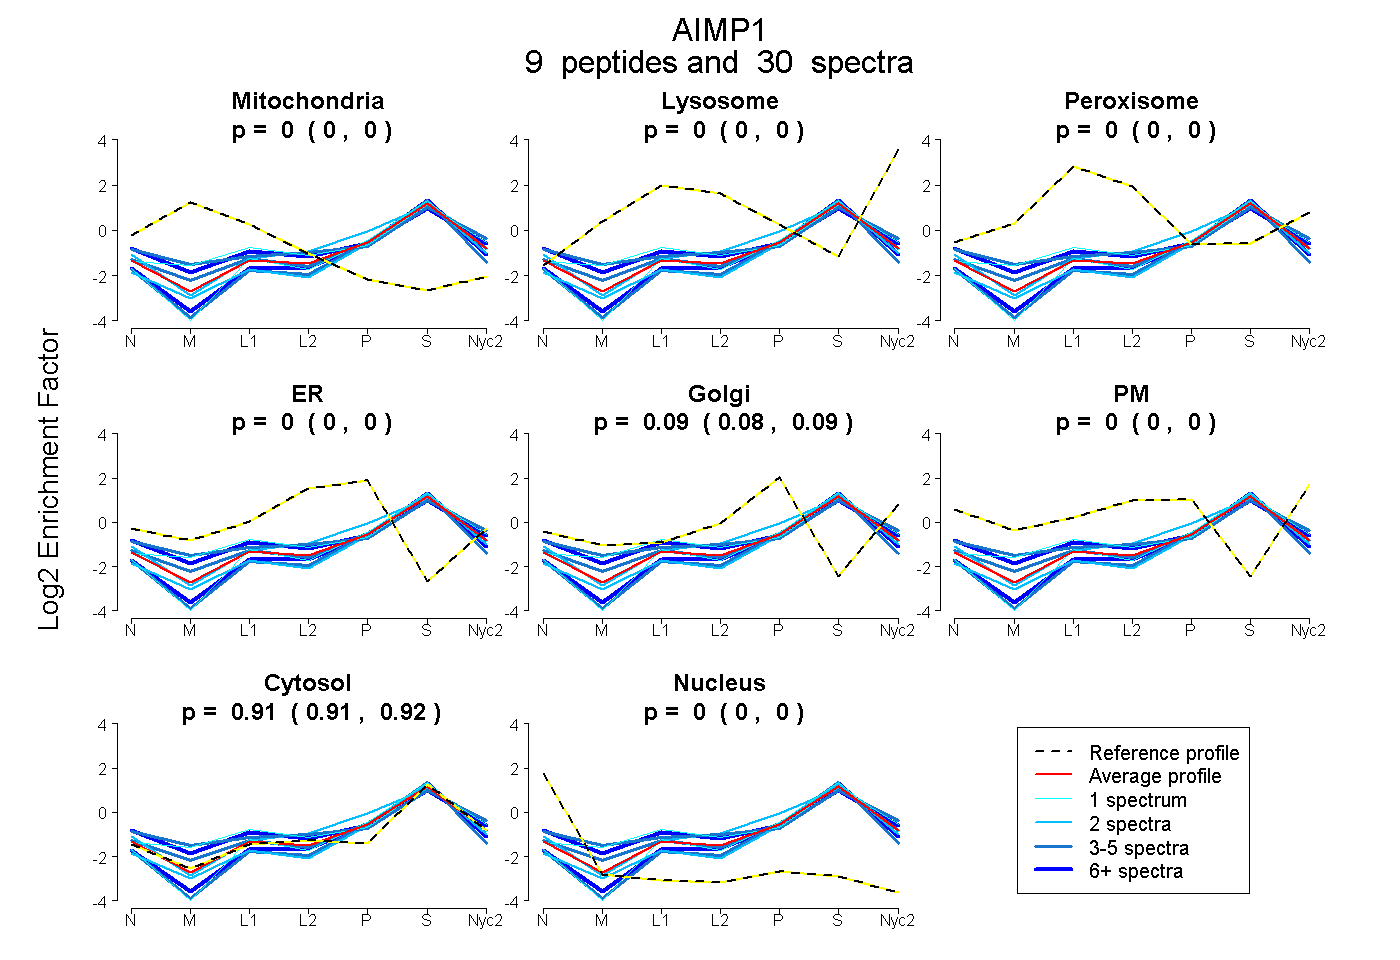
| Expt A |
9 peptides |
30 spectra |
|
0.000 0.000 | 0.000 |
0.000 0.000 | 0.000 |
0.000 0.000 | 0.000 |
0.000 0.000 | 0.000 |
0.087 0.080 | 0.093 |
0.000 0.000 | 0.000 |
0.913 0.906 | 0.919 |
0.000 0.000 | 0.000 |
| 3 spectra, TVVSGLVNHVPLEQMQNR | 0.022 | 0.021 | 0.015 | 0.000 | 0.000 | 0.148 | 0.794 | 0.000 | ||
| 3 spectra, GAPFEVK | 0.000 | 0.000 | 0.000 | 0.000 | 0.112 | 0.000 | 0.888 | 0.000 | ||
| 1 spectrum, VEILAPPNGSVPGDR | 0.012 | 0.042 | 0.091 | 0.000 | 0.050 | 0.000 | 0.805 | 0.000 | ||
| 6 spectra, AILQATLR | 0.000 | 0.000 | 0.000 | 0.000 | 0.000 | 0.000 | 1.000 | 0.000 | ||
| 4 spectra, GAEADQIIEYLK | 0.000 | 0.000 | 0.000 | 0.000 | 0.000 | 0.000 | 0.966 | 0.034 | ||
| 1 spectrum, SASVTTTTMTGGGGEEK | 0.000 | 0.000 | 0.000 | 0.000 | 0.000 | 0.000 | 1.000 | 0.000 | ||
| 8 spectra, AQTMANSGIK | 0.008 | 0.000 | 0.076 | 0.000 | 0.129 | 0.000 | 0.786 | 0.000 | ||
| 2 spectra, QQSAAASADSKPVDVSR | 0.000 | 0.000 | 0.000 | 0.000 | 0.000 | 0.000 | 0.997 | 0.003 | ||
| 2 spectra, QQVALLK | 0.000 | 0.000 | 0.000 | 0.000 | 0.187 | 0.000 | 0.813 | 0.000 |
| Plot | Mito | Lyso or Perox | ER | Golgi | PM | Cytosol | Nucleus | ||||||
| Expt B |
1 peptide |
3 spectra |
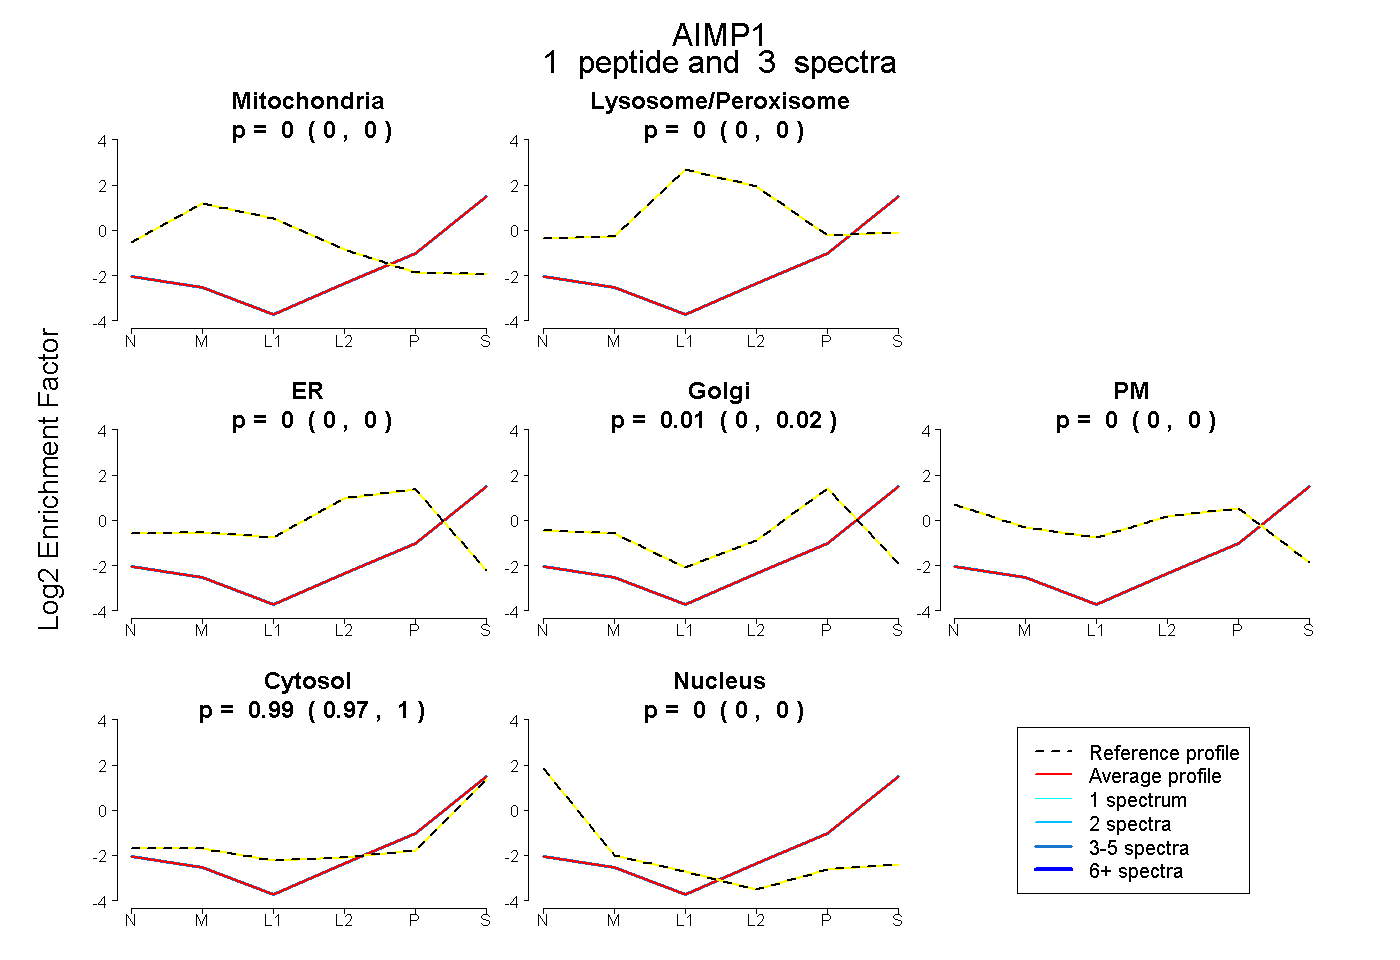 |
0.000 0.000 | 0.000 |
0.000 0.000 | 0.000 |
0.000 0.000 | 0.000 |
0.006 0.000 | 0.022 |
0.000 0.000 | 0.000 |
0.994 0.974 | 1.000 |
0.000 0.000 | 0.000 |
|||
| Plot | Lyso | Other | |||||||||||
| Expt C |
8 peptides |
17 spectra |
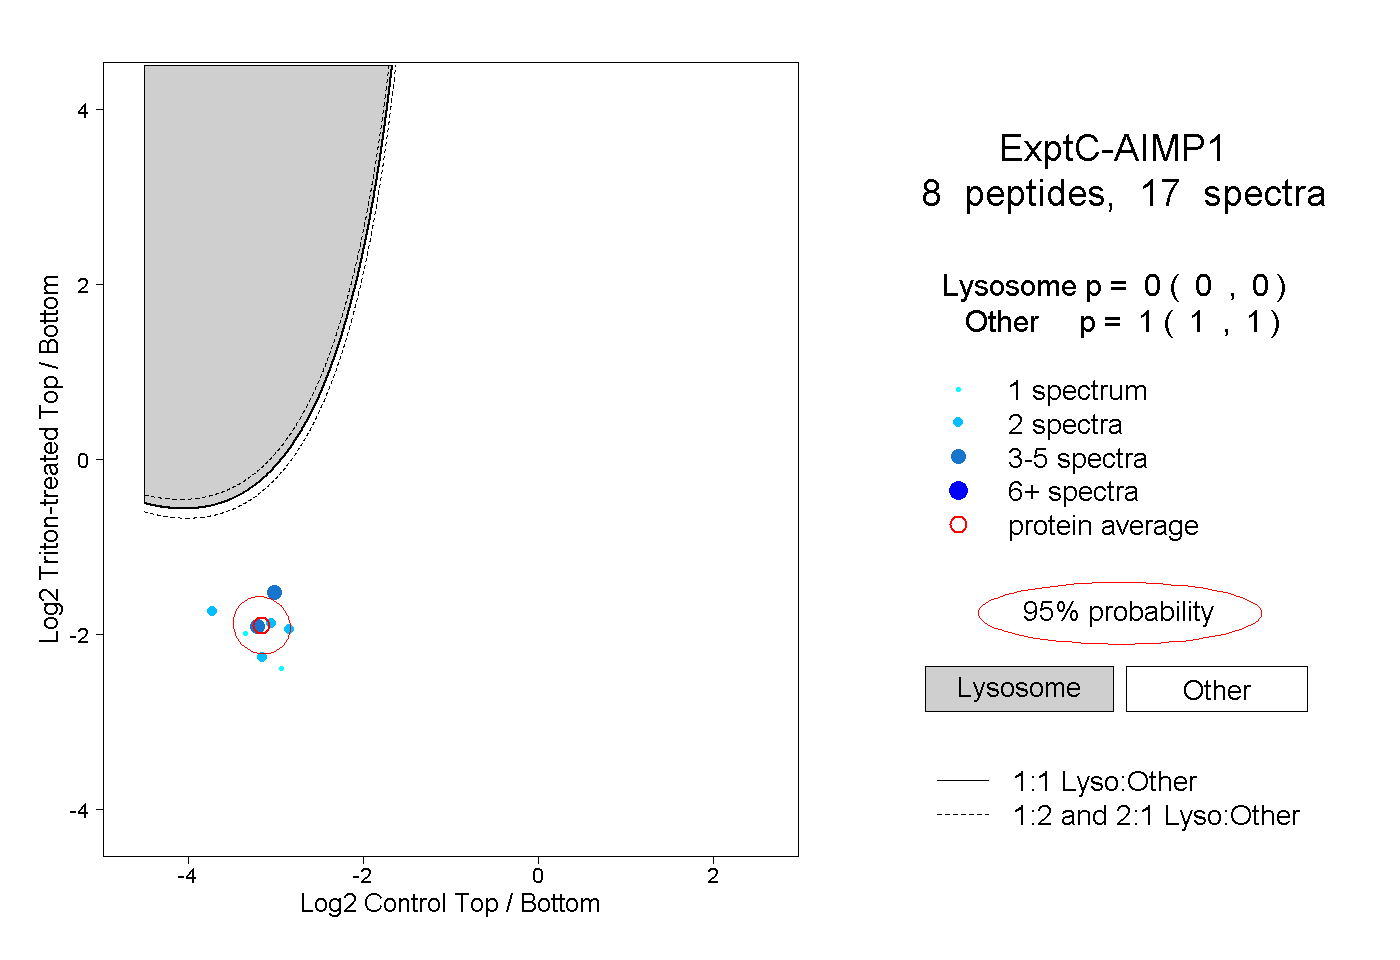 |
0.000 0.000 | 0.000 |
1.000 1.000 | 1.000 |