8
8peptides
spectra
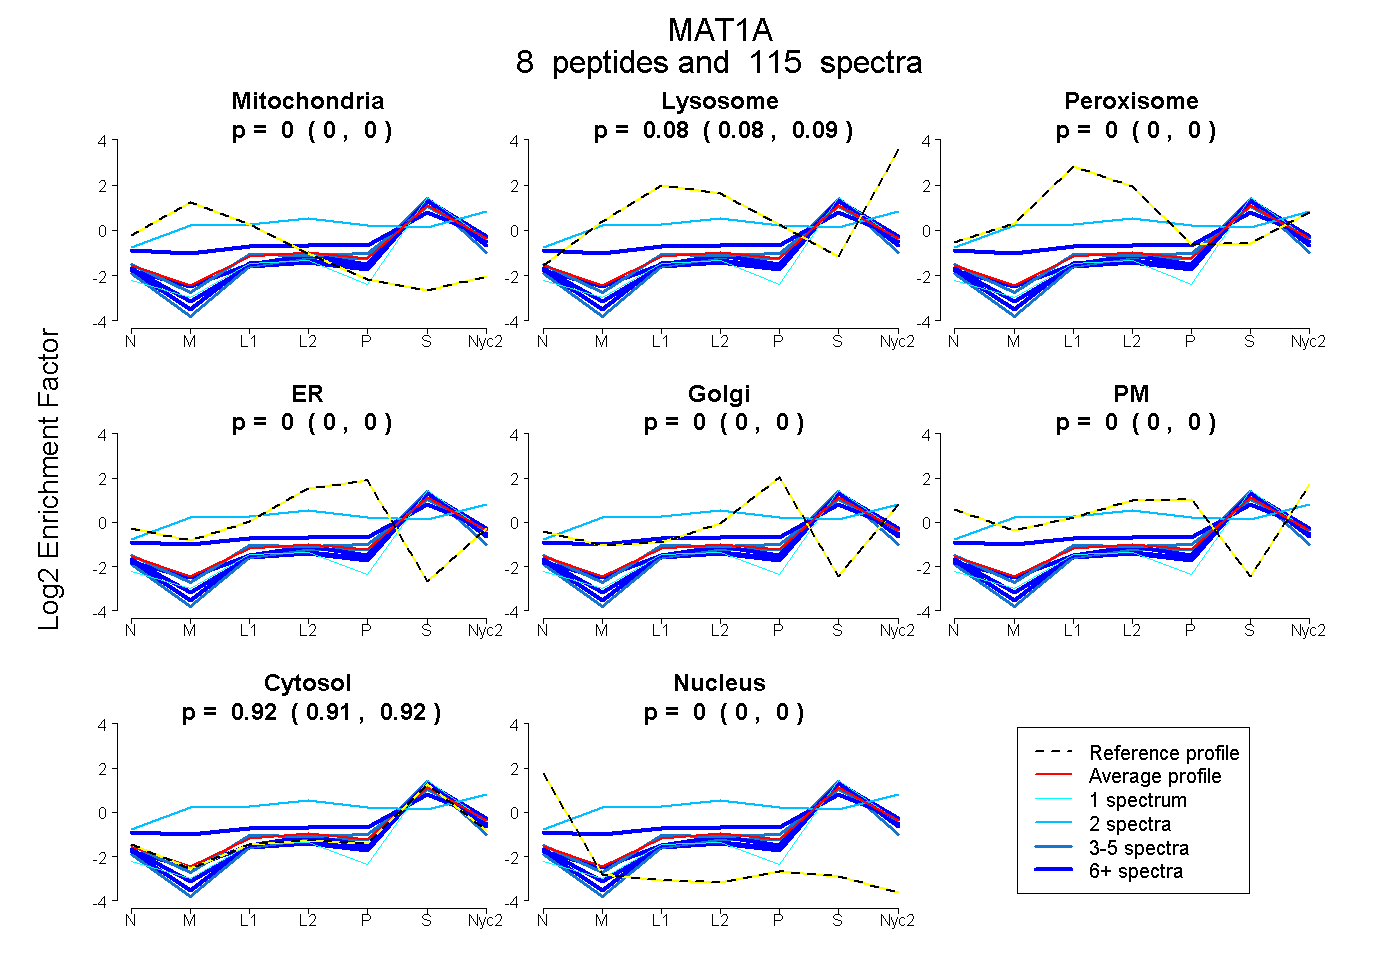
0.000 | 0.000
0.077 | 0.088
0.000 | 0.000
0.000 | 0.000
0.000 | 0.000
0.000 | 0.000
0.910 | 0.922
0.000 | 0.000
9peptides
spectra
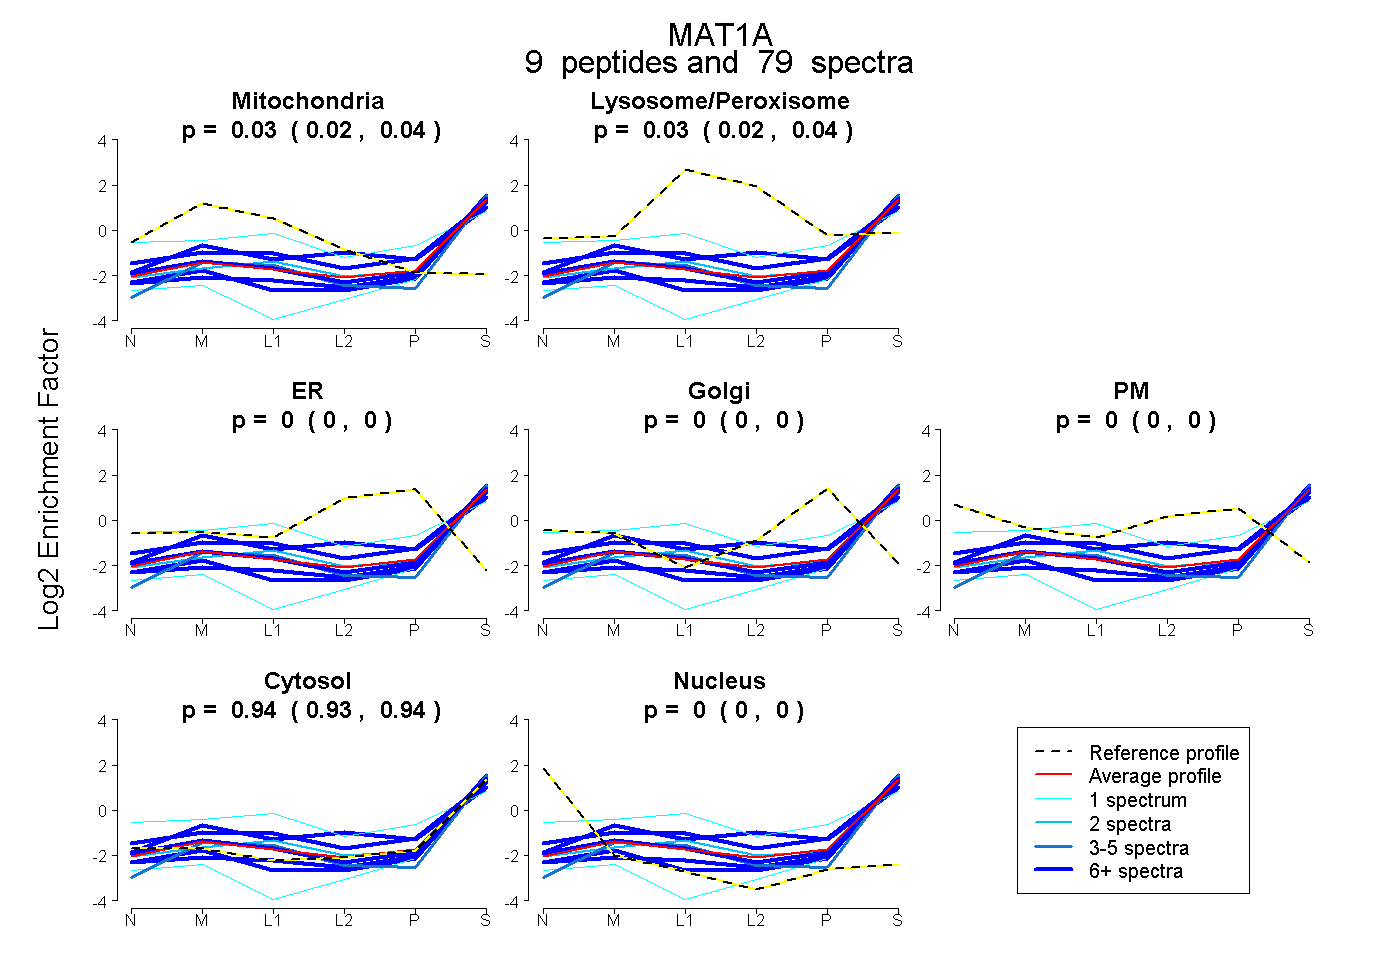
0.022 | 0.040
0.022 | 0.041
0.000 | 0.000
0.000 | 0.000
0.000 | 0.000
0.928 | 0.942
0.000 | 0.000
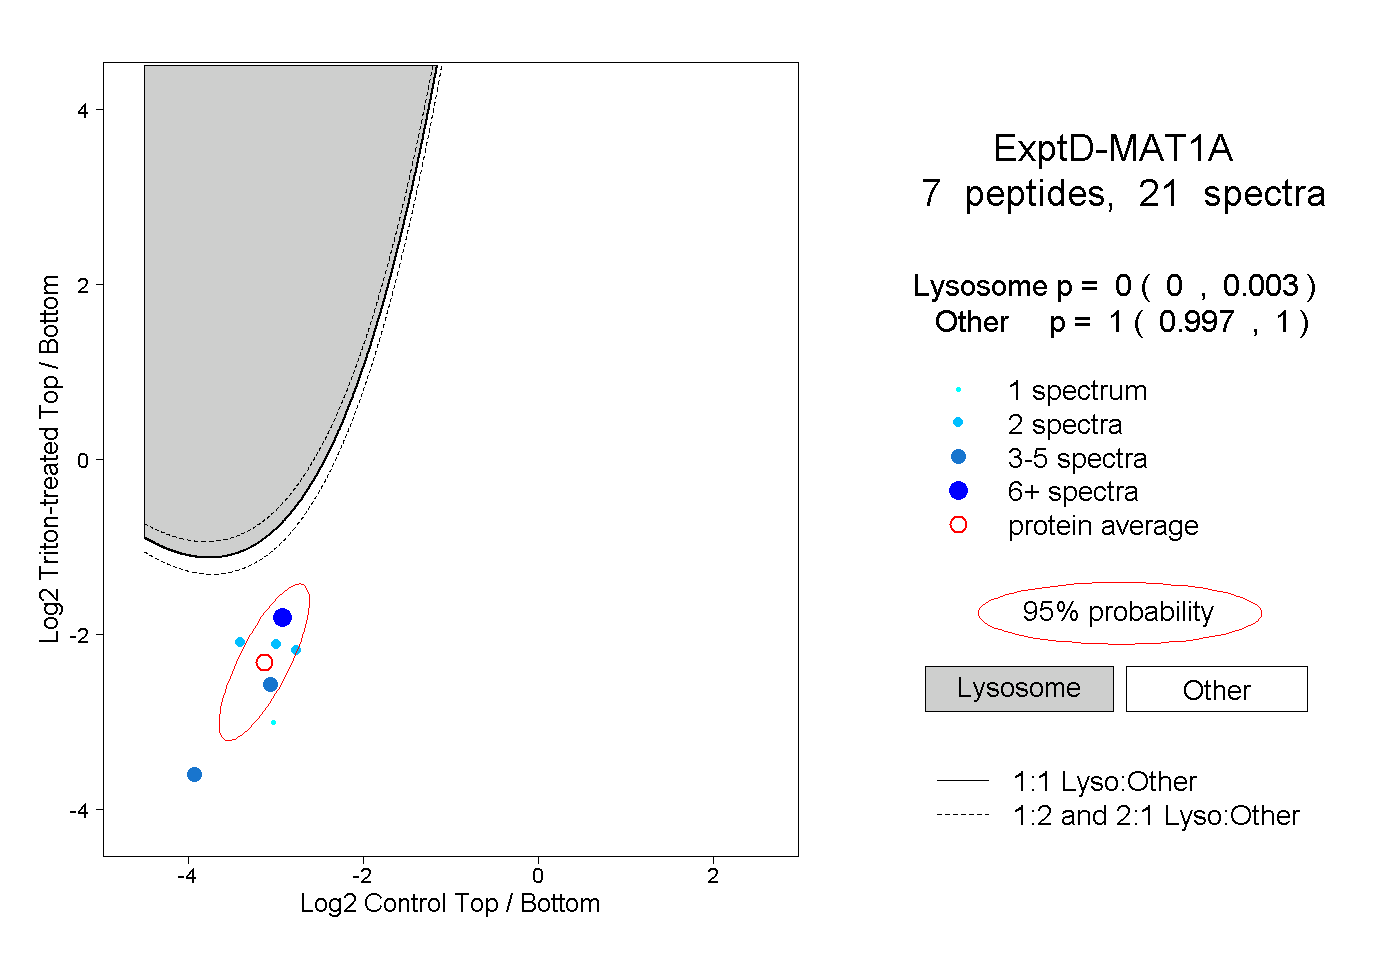
10peptides
spectra
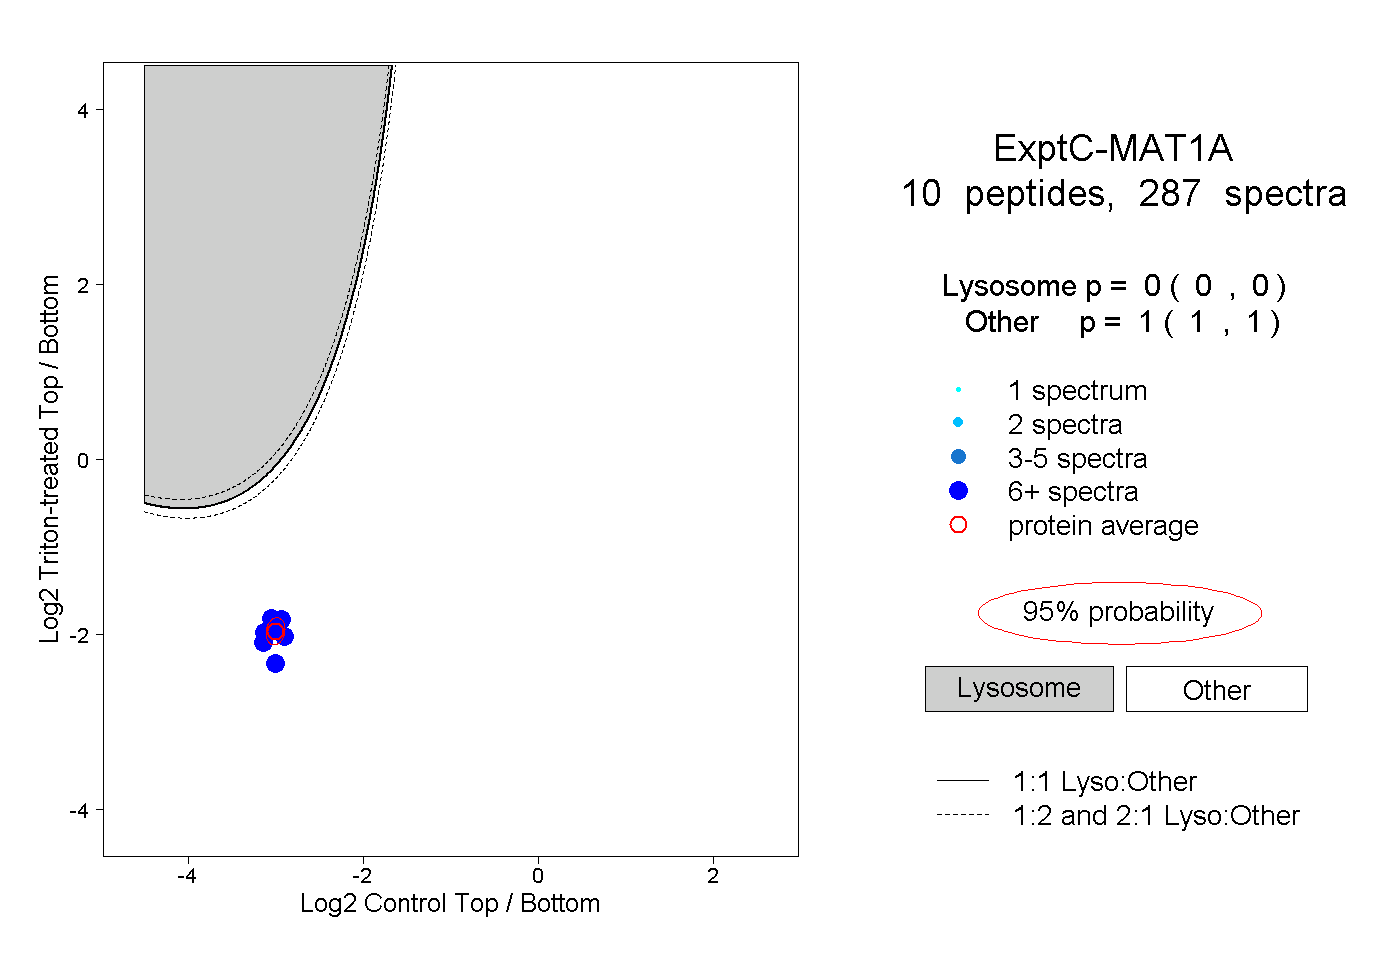
0.000 | 0.000
1.000 | 1.000