 8
8peptides
spectra
0.000 | 0.000
0.077 | 0.088
0.000 | 0.000
0.000 | 0.000
0.000 | 0.000
0.000 | 0.000
0.910 | 0.922
0.000 | 0.000
| Plot | Mito | Lyso | Perox | ER | Golgi | PM | Cytosol | Nucleus | |||||
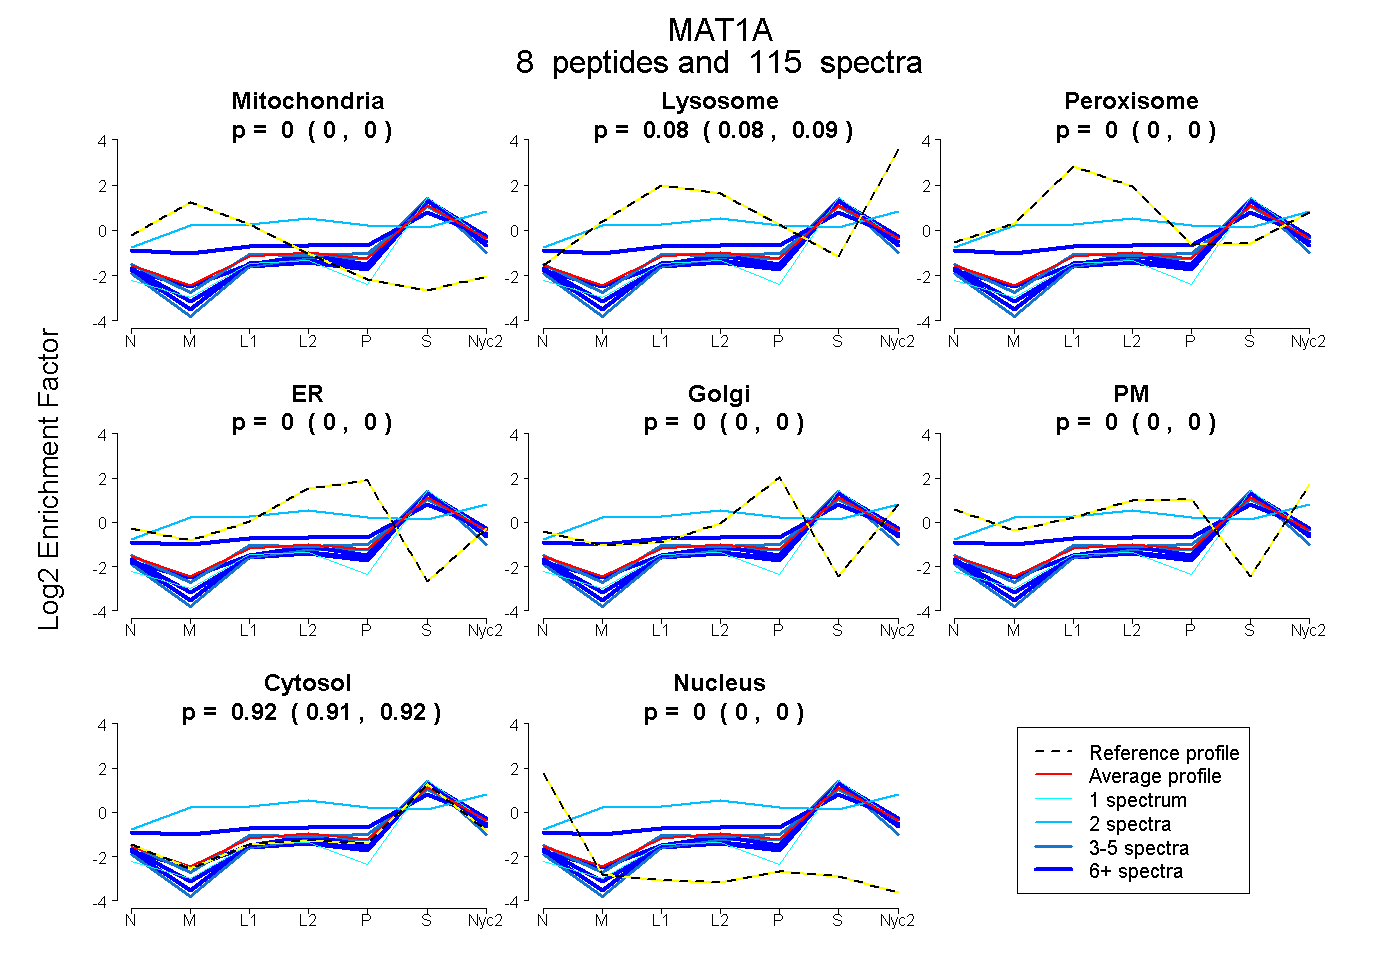
| Expt A |
8 peptides |
115 spectra |
|
0.000 0.000 | 0.000 |
0.084 0.077 | 0.088 |
0.000 0.000 | 0.000 |
0.000 0.000 | 0.000 |
0.000 0.000 | 0.000 |
0.000 0.000 | 0.000 |
0.916 0.910 | 0.922 |
0.000 0.000 | 0.000 |
| 22 spectra, FVIGGPQGDAGVTGR | 0.000 | 0.000 | 0.000 | 0.000 | 0.000 | 0.000 | 1.000 | 0.000 | ||
| 36 spectra, TACYGHFGR | 0.069 | 0.062 | 0.124 | 0.000 | 0.067 | 0.019 | 0.659 | 0.000 | ||
| 3 spectra, KPIYQK | 0.000 | 0.000 | 0.000 | 0.000 | 0.000 | 0.000 | 1.000 | 0.000 | ||
| 15 spectra, ELLEVVNK | 0.000 | 0.000 | 0.000 | 0.000 | 0.000 | 0.000 | 1.000 | 0.000 | ||
| 2 spectra, VHTIVISVQHNEDITLEAMR | 0.027 | 0.223 | 0.282 | 0.000 | 0.188 | 0.000 | 0.280 | 0.000 | ||
| 1 spectrum, TQVTVQYVQDNGAVIPVR | 0.000 | 0.000 | 0.000 | 0.000 | 0.000 | 0.000 | 1.000 | 0.000 | ||
| 33 spectra, NFDLRPGVIVR | 0.000 | 0.048 | 0.000 | 0.000 | 0.000 | 0.000 | 0.952 | 0.000 | ||
| 3 spectra, SEFPWEVPK | 0.000 | 0.064 | 0.000 | 0.000 | 0.027 | 0.000 | 0.909 | 0.000 |
| Plot | Mito | Lyso or Perox | ER | Golgi | PM | Cytosol | Nucleus | ||||||
| Expt B |
9 peptides |
79 spectra |
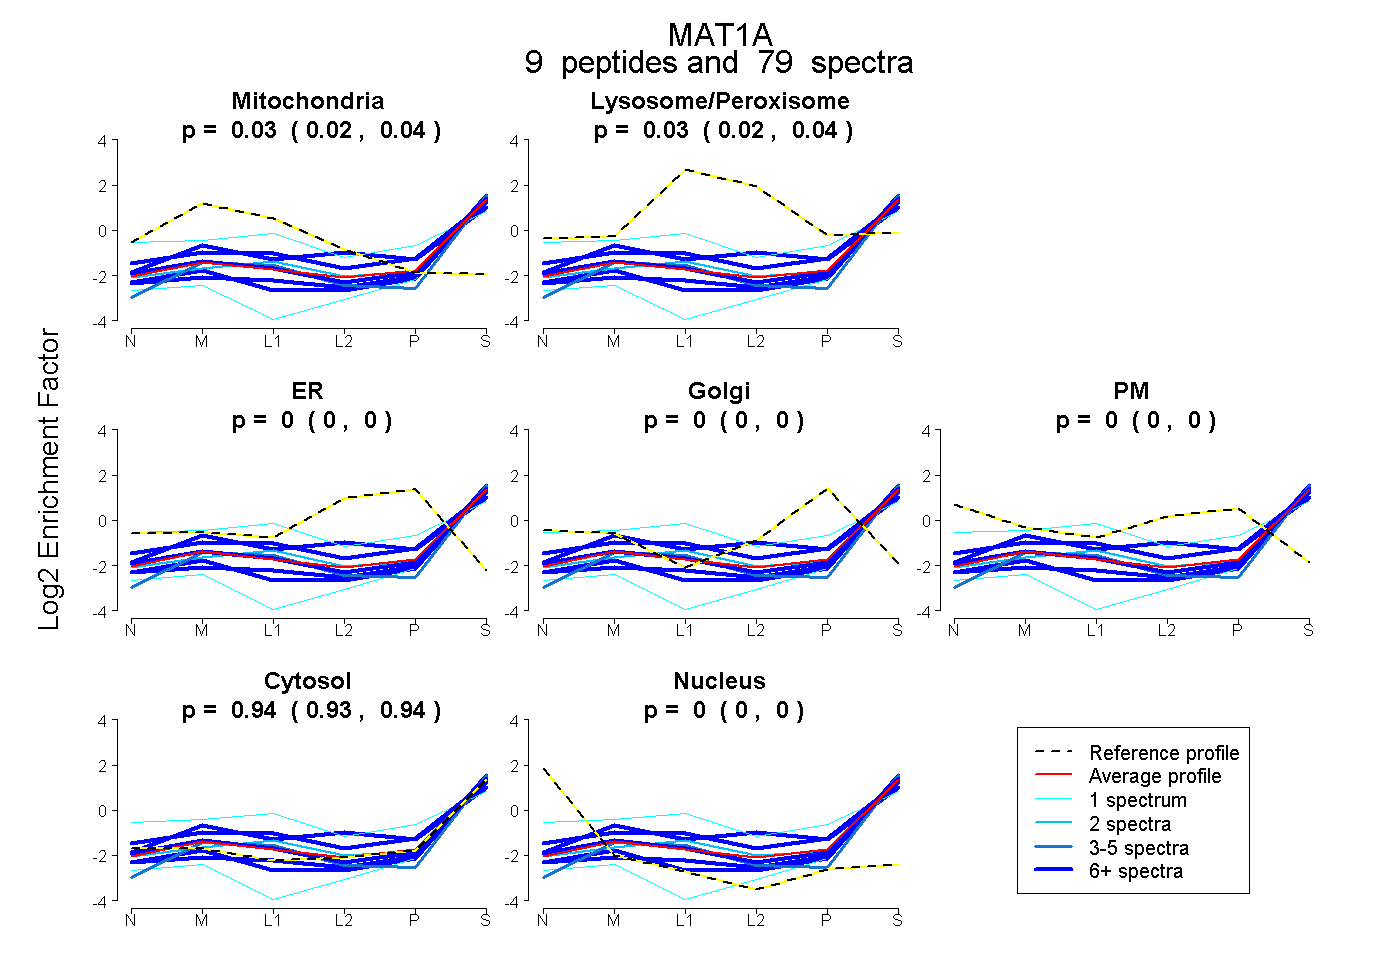 |
0.032 0.022 | 0.040 |
0.032 0.022 | 0.041 |
0.000 0.000 | 0.000 |
0.000 0.000 | 0.000 |
0.000 0.000 | 0.000 |
0.936 0.928 | 0.942 |
0.000 0.000 | 0.000 |
|||
| Plot | Lyso | Other | |||||||||||
| Expt C |
10 peptides |
287 spectra |
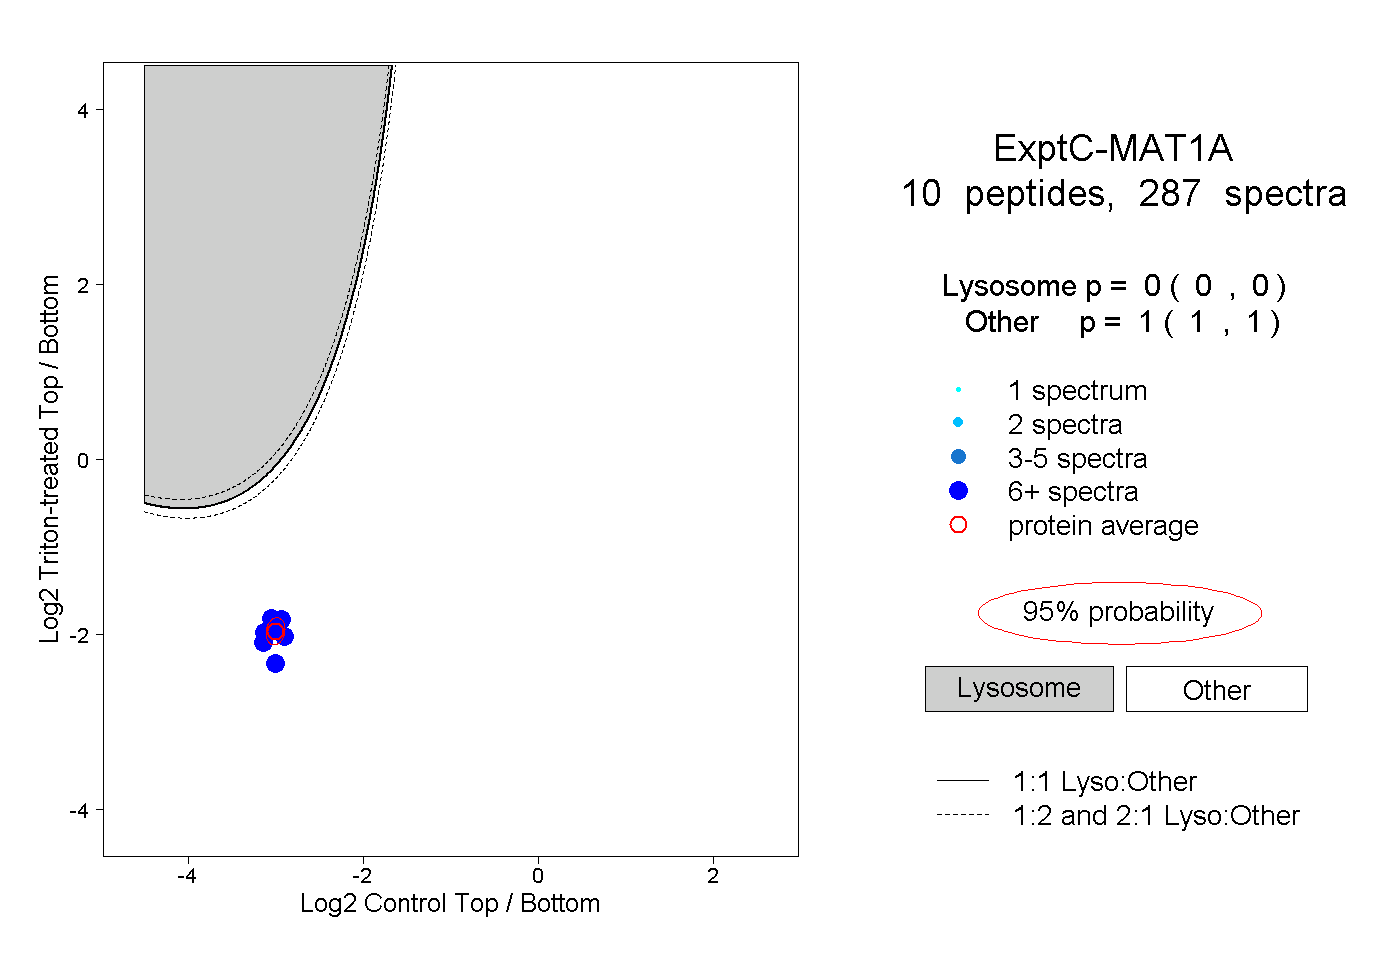 |
0.000 0.000 | 0.000 |
1.000 1.000 | 1.000 |
||||||||
| Plot | Lyso | Other | |||||||||||
| Expt D |
7 peptides |
21 spectra |
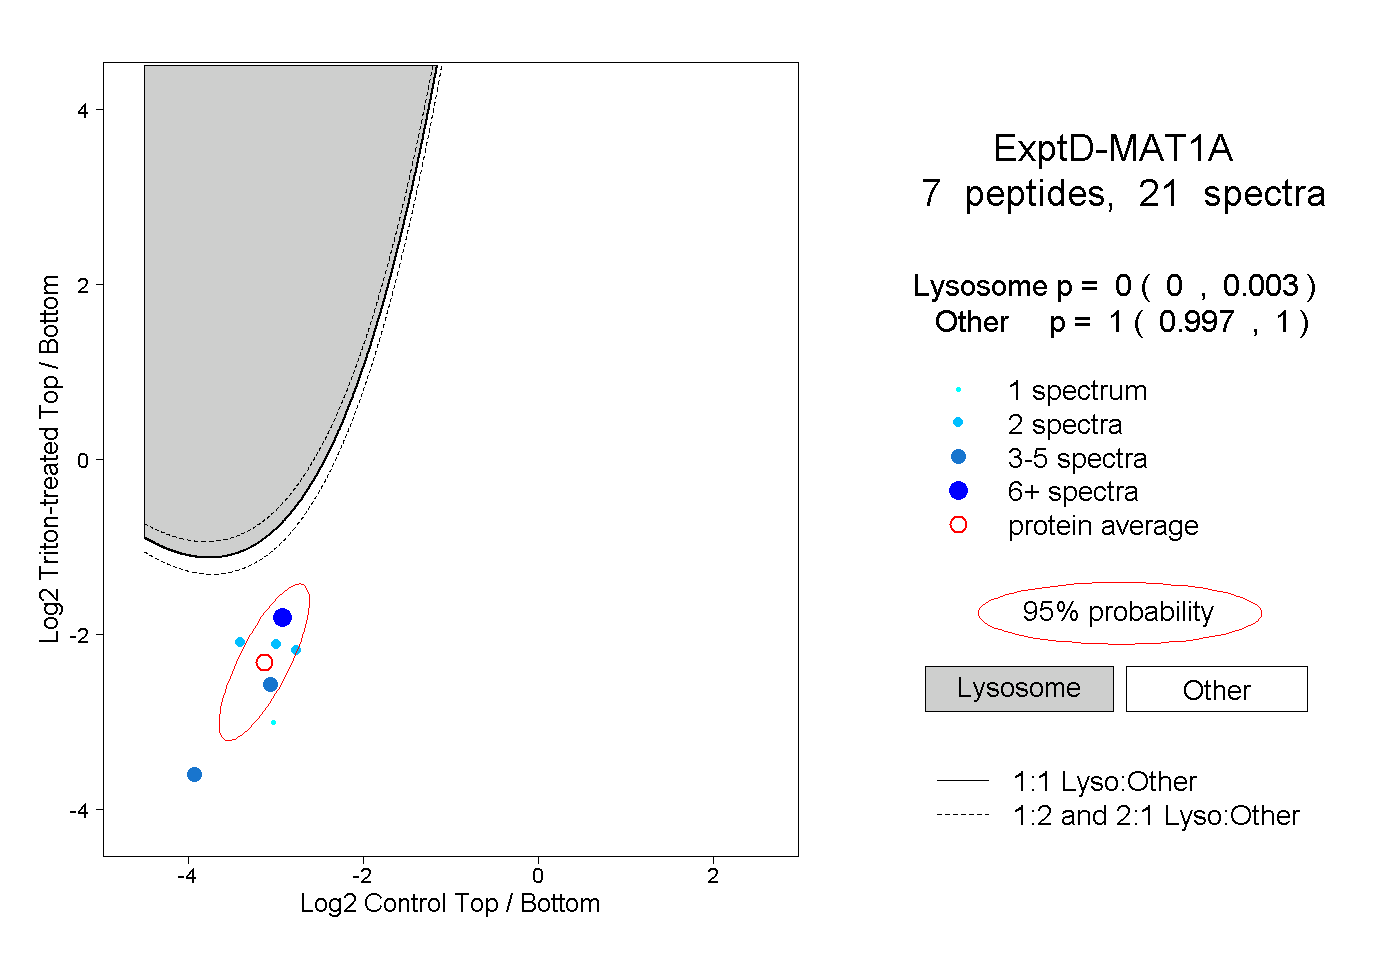 |
0.000 0.000 | 0.003 |
1.000 0.997 | 1.000 |