12
12peptides
spectra
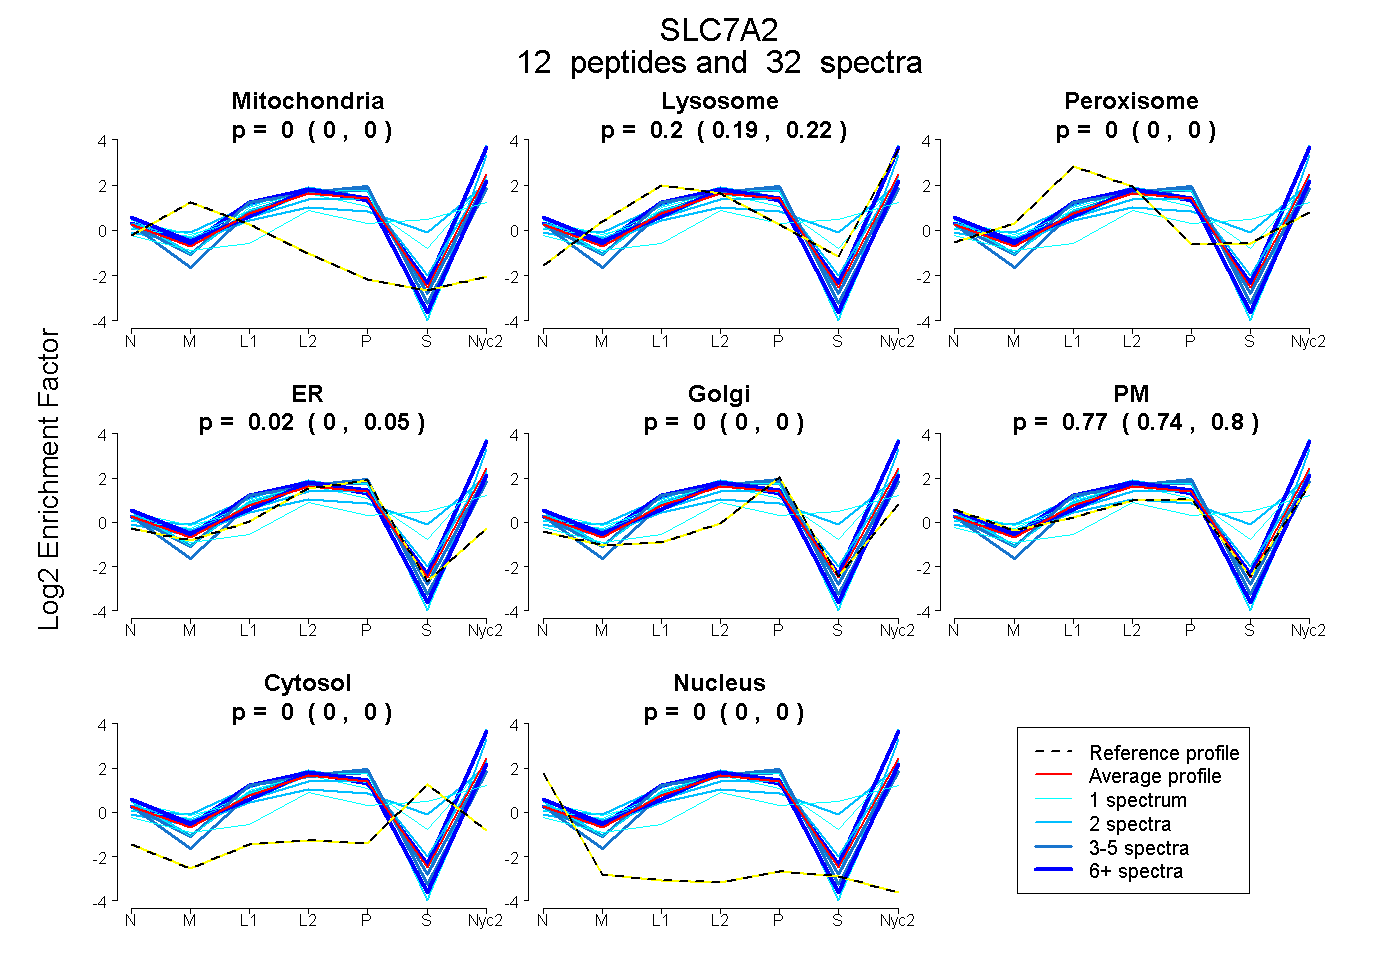
0.000 | 0.000
0.187 | 0.216
0.000 | 0.000
0.001 | 0.046
0.000 | 0.000
0.744 | 0.795
0.000 | 0.000
0.000 | 0.000
5peptides
spectra
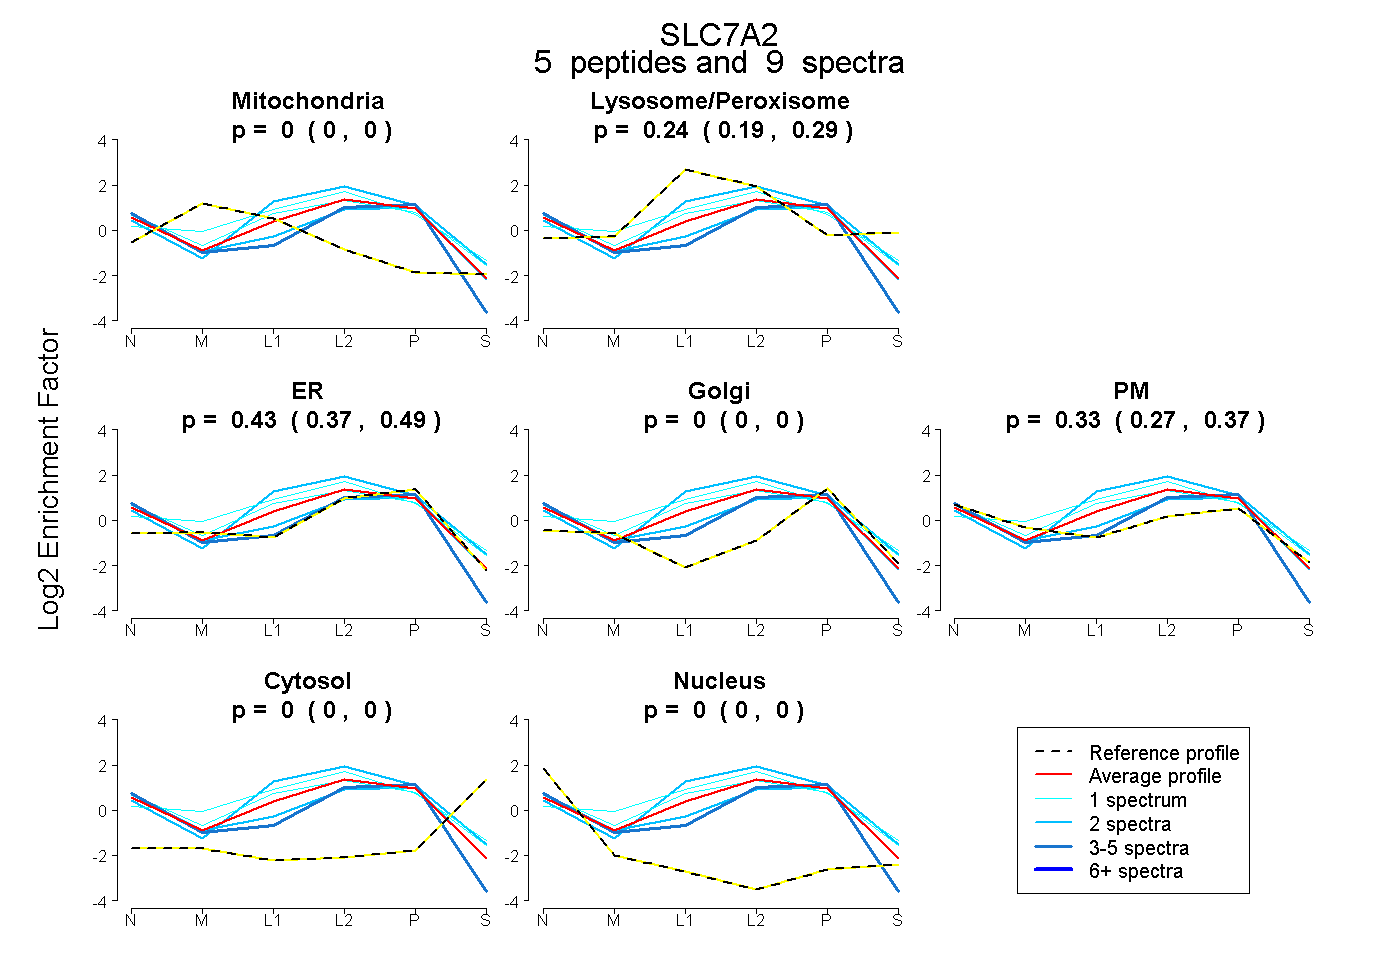
0.000 | 0.000
0.191 | 0.287
0.367 | 0.489
0.000 | 0.000
0.266 | 0.371
0.000 | 0.000
0.000 | 0.000
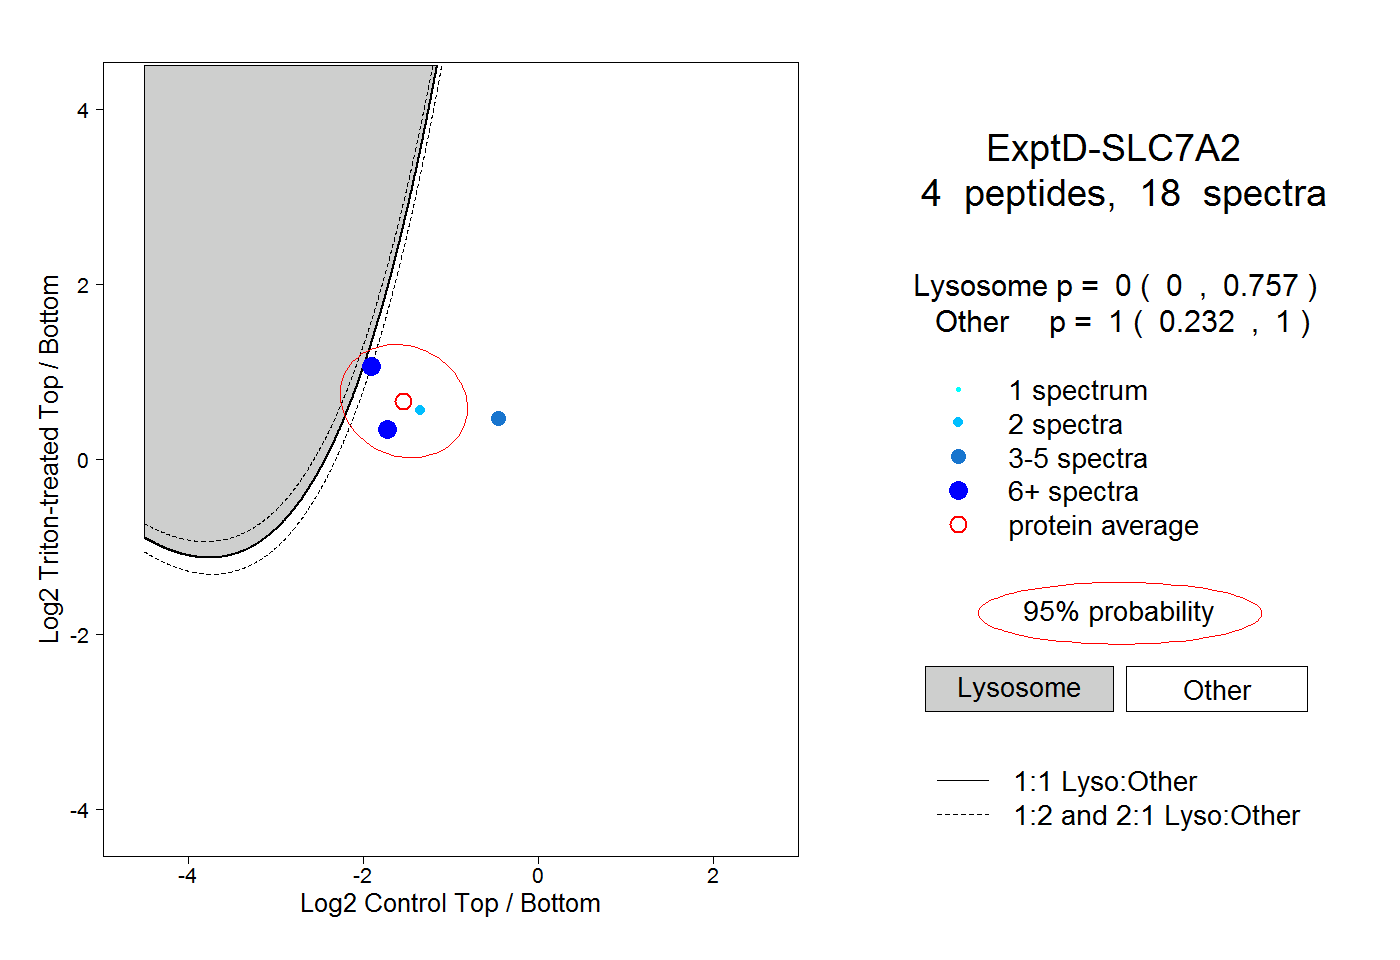
14peptides
spectra
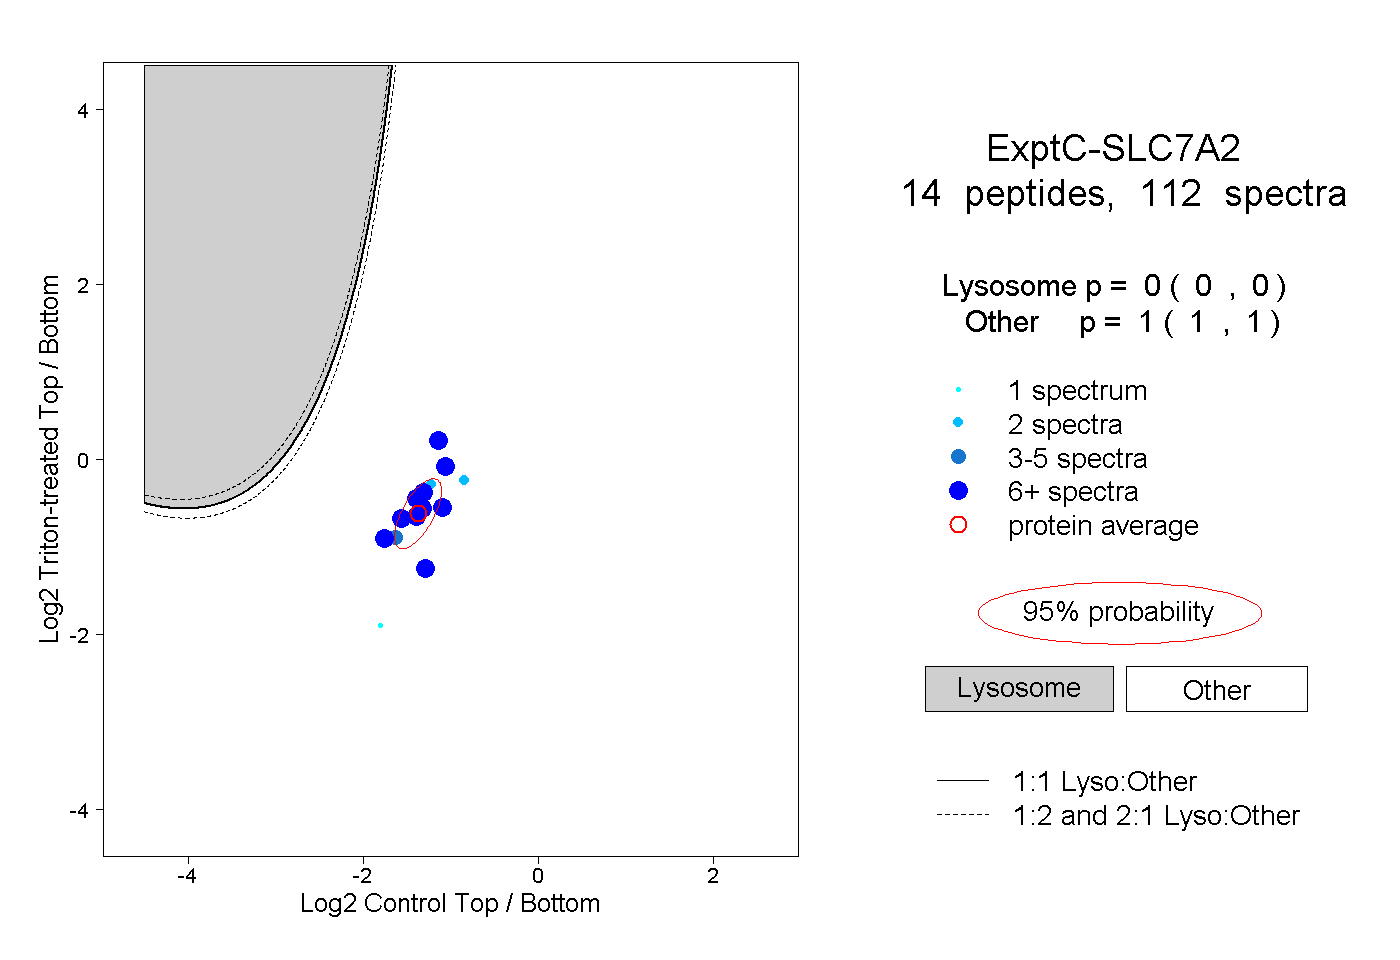
0.000 | 0.000
1.000 | 1.000