 12
12peptides
spectra
0.000 | 0.000
0.187 | 0.216
0.000 | 0.000
0.001 | 0.046
0.000 | 0.000
0.744 | 0.795
0.000 | 0.000
0.000 | 0.000
| Plot | Mito | Lyso | Perox | ER | Golgi | PM | Cytosol | Nucleus | |||||
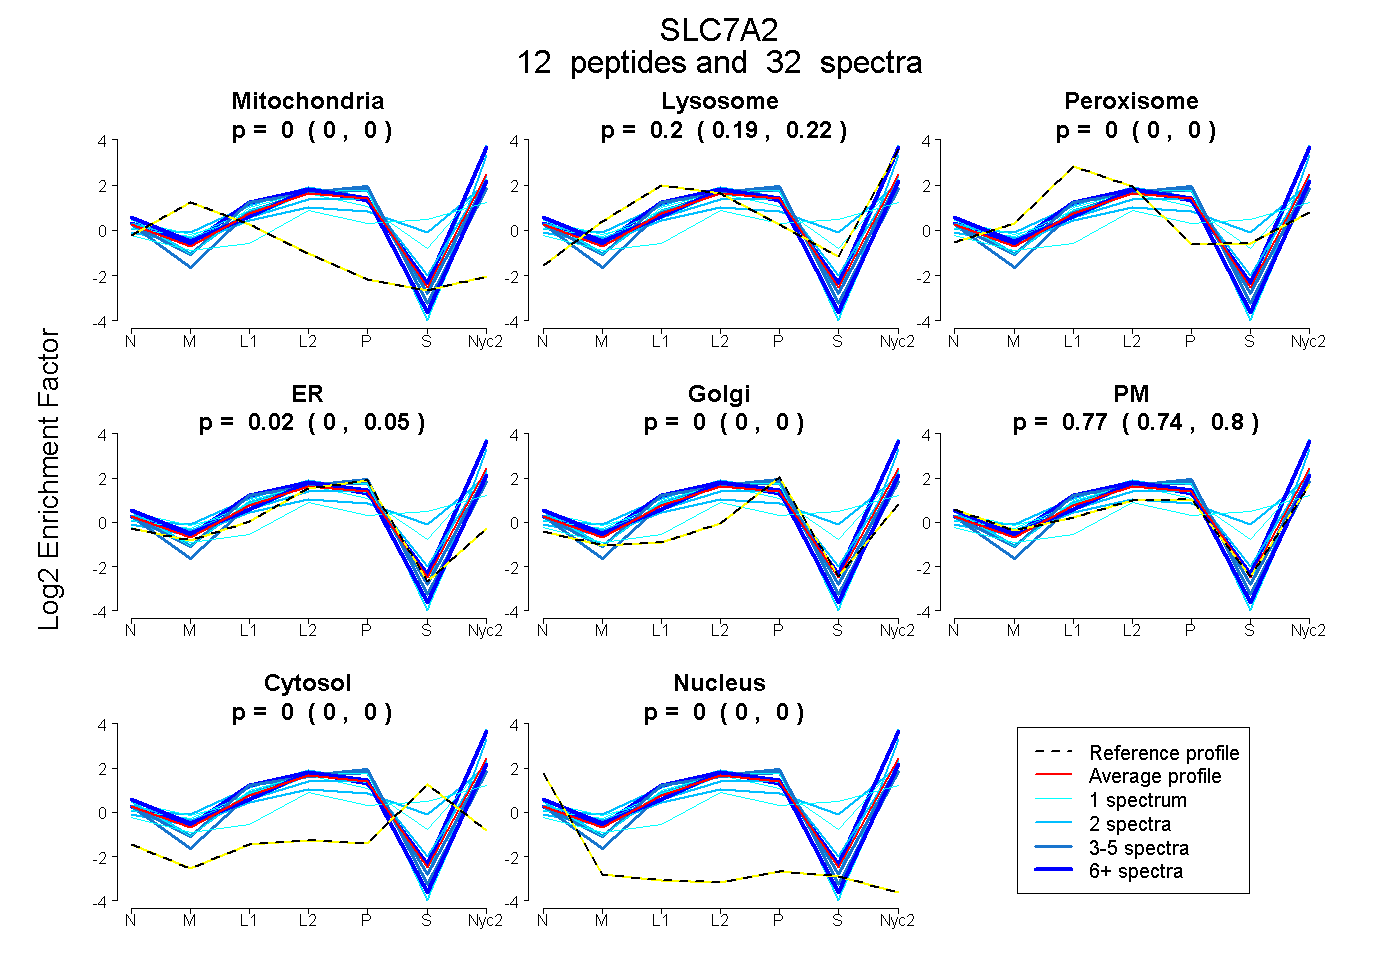
| Expt A |
12 peptides |
32 spectra |
|
0.000 0.000 | 0.000 |
0.203 0.187 | 0.216 |
0.000 0.000 | 0.000 |
0.024 0.001 | 0.046 |
0.000 0.000 | 0.000 |
0.773 0.744 | 0.795 |
0.000 0.000 | 0.000 |
0.000 0.000 | 0.000 |
| 2 spectra, GNVANWK | 0.000 | 0.446 | 0.000 | 0.000 | 0.000 | 0.554 | 0.000 | 0.000 | ||
| 7 spectra, TLFNPSALPTR | 0.000 | 0.015 | 0.000 | 0.035 | 0.000 | 0.949 | 0.000 | 0.000 | ||
| 2 spectra, QPQNQQK | 0.000 | 0.216 | 0.000 | 0.000 | 0.000 | 0.784 | 0.000 | 0.000 | ||
| 1 spectrum, SESQVTMLQGQGFSLR | 0.000 | 0.009 | 0.000 | 0.078 | 0.000 | 0.913 | 0.000 | 0.000 | ||
| 1 spectrum, QIGQFFK | 0.000 | 0.326 | 0.115 | 0.008 | 0.000 | 0.501 | 0.049 | 0.000 | ||
| 2 spectra, DGLLFR | 0.000 | 0.110 | 0.000 | 0.000 | 0.000 | 0.890 | 0.000 | 0.000 | ||
| 1 spectrum, IVTLDSLEDSK | 0.000 | 0.033 | 0.000 | 0.089 | 0.000 | 0.878 | 0.000 | 0.000 | ||
| 6 spectra, ISEEFLK | 0.000 | 0.439 | 0.000 | 0.000 | 0.000 | 0.561 | 0.000 | 0.000 | ||
| 3 spectra, NLSLPFILHEK | 0.000 | 0.046 | 0.000 | 0.308 | 0.000 | 0.646 | 0.000 | 0.000 | ||
| 2 spectra, DILESCTNATSK | 0.000 | 0.394 | 0.000 | 0.000 | 0.000 | 0.382 | 0.224 | 0.000 | ||
| 1 spectrum, VIYAMAEDGLLFK | 0.000 | 0.229 | 0.002 | 0.000 | 0.000 | 0.348 | 0.422 | 0.000 | ||
| 4 spectra, SAMQANDHHQR | 0.000 | 0.192 | 0.000 | 0.189 | 0.000 | 0.619 | 0.000 | 0.000 |
| Plot | Mito | Lyso or Perox | ER | Golgi | PM | Cytosol | Nucleus | ||||||
| Expt B |
5 peptides |
9 spectra |
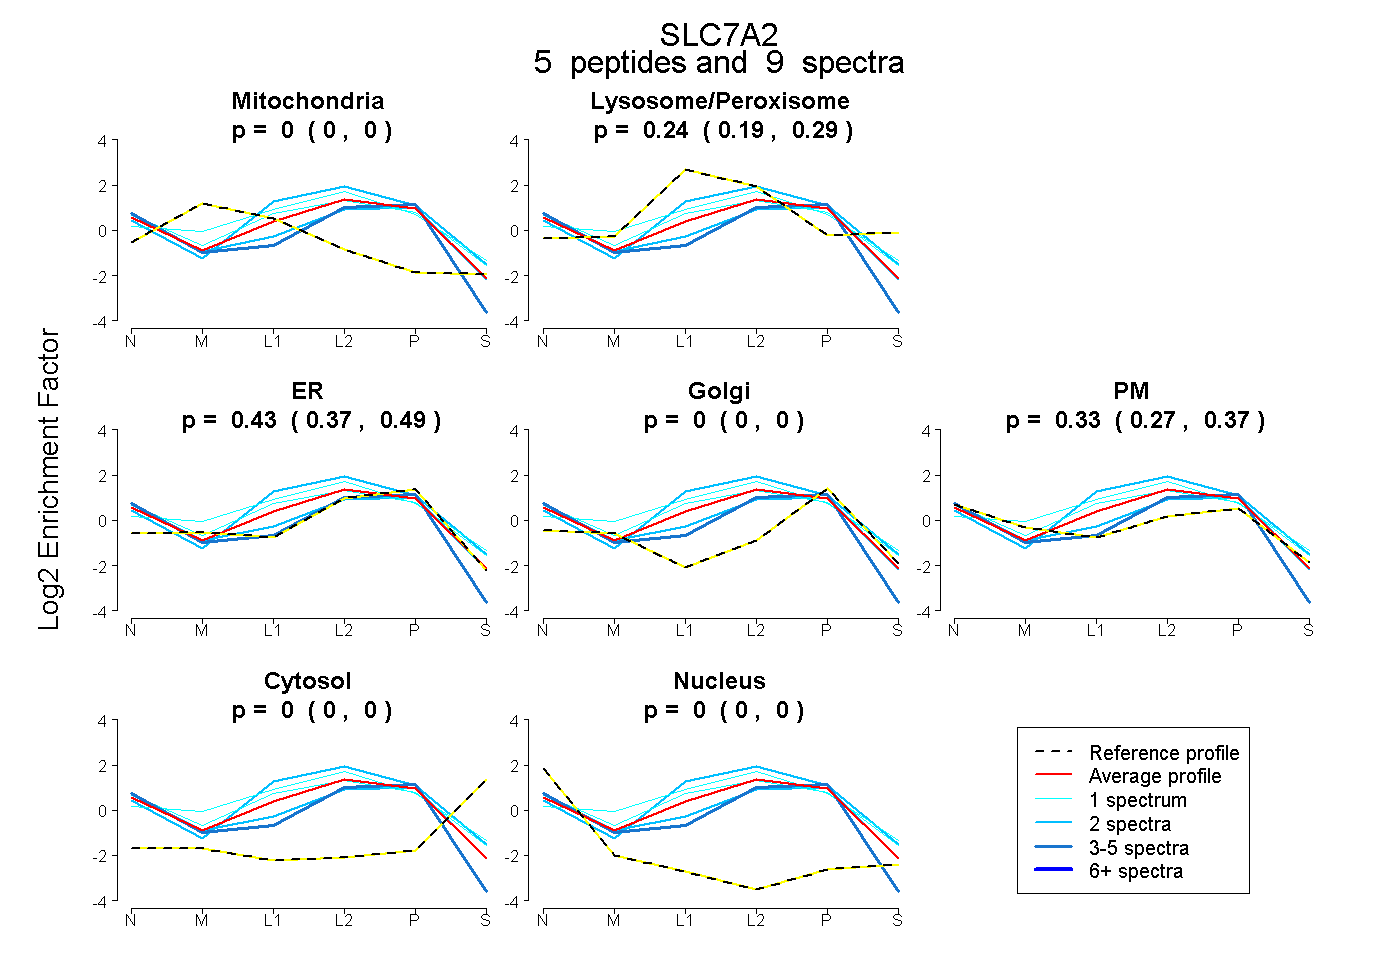 |
0.000 0.000 | 0.000 |
0.244 0.191 | 0.287 |
0.431 0.367 | 0.489 |
0.000 0.000 | 0.000 |
0.325 0.266 | 0.371 |
0.000 0.000 | 0.000 |
0.000 0.000 | 0.000 |
|||
| Plot | Lyso | Other | |||||||||||
| Expt C |
14 peptides |
112 spectra |
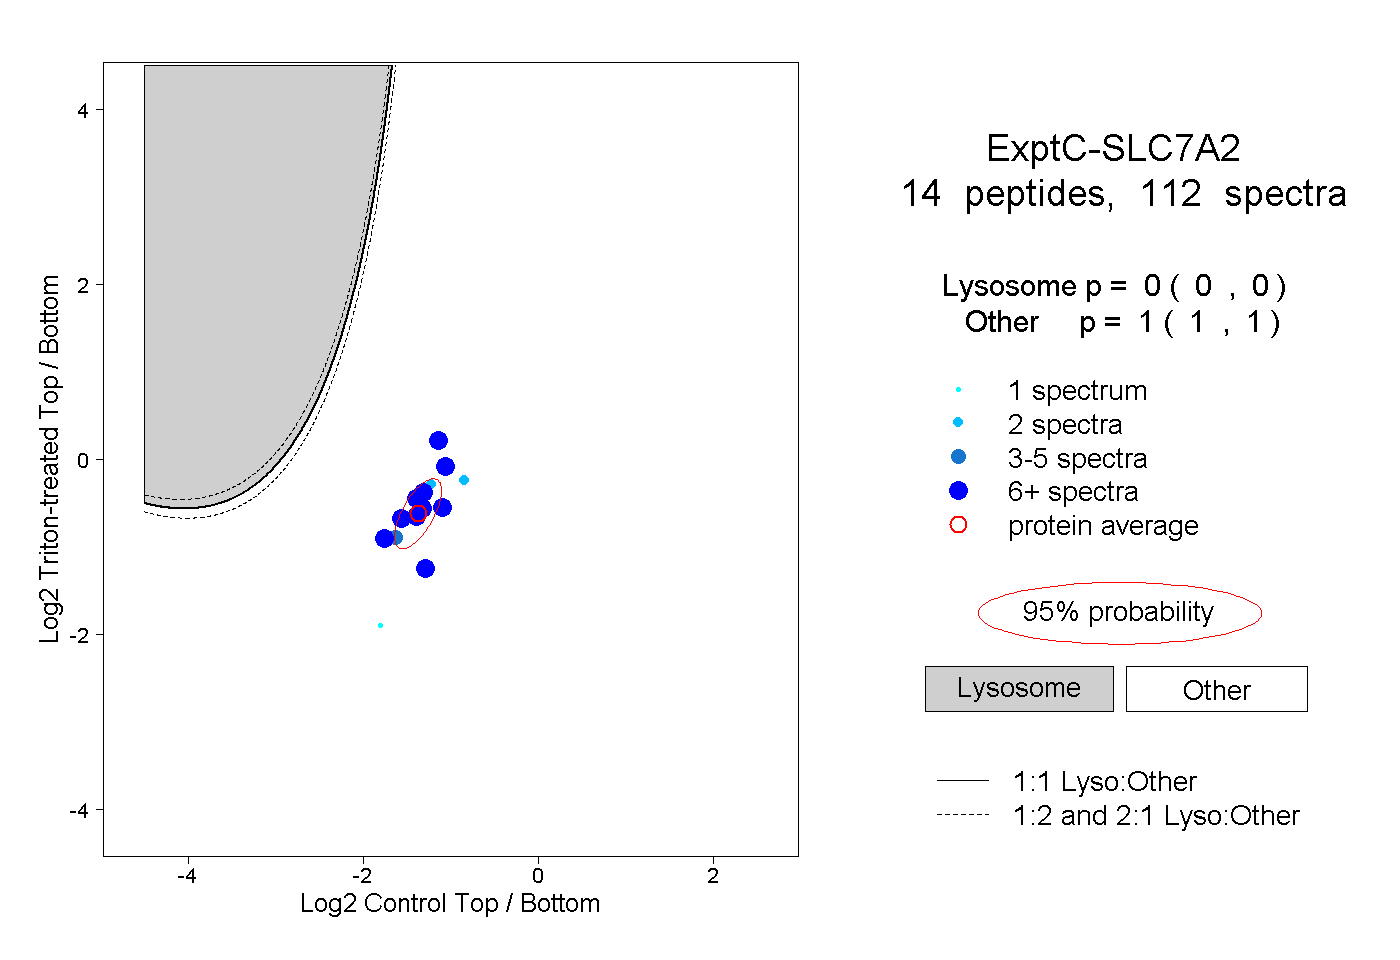 |
0.000 0.000 | 0.000 |
1.000 1.000 | 1.000 |
||||||||
| Plot | Lyso | Other | |||||||||||
| Expt D |
4 peptides |
18 spectra |
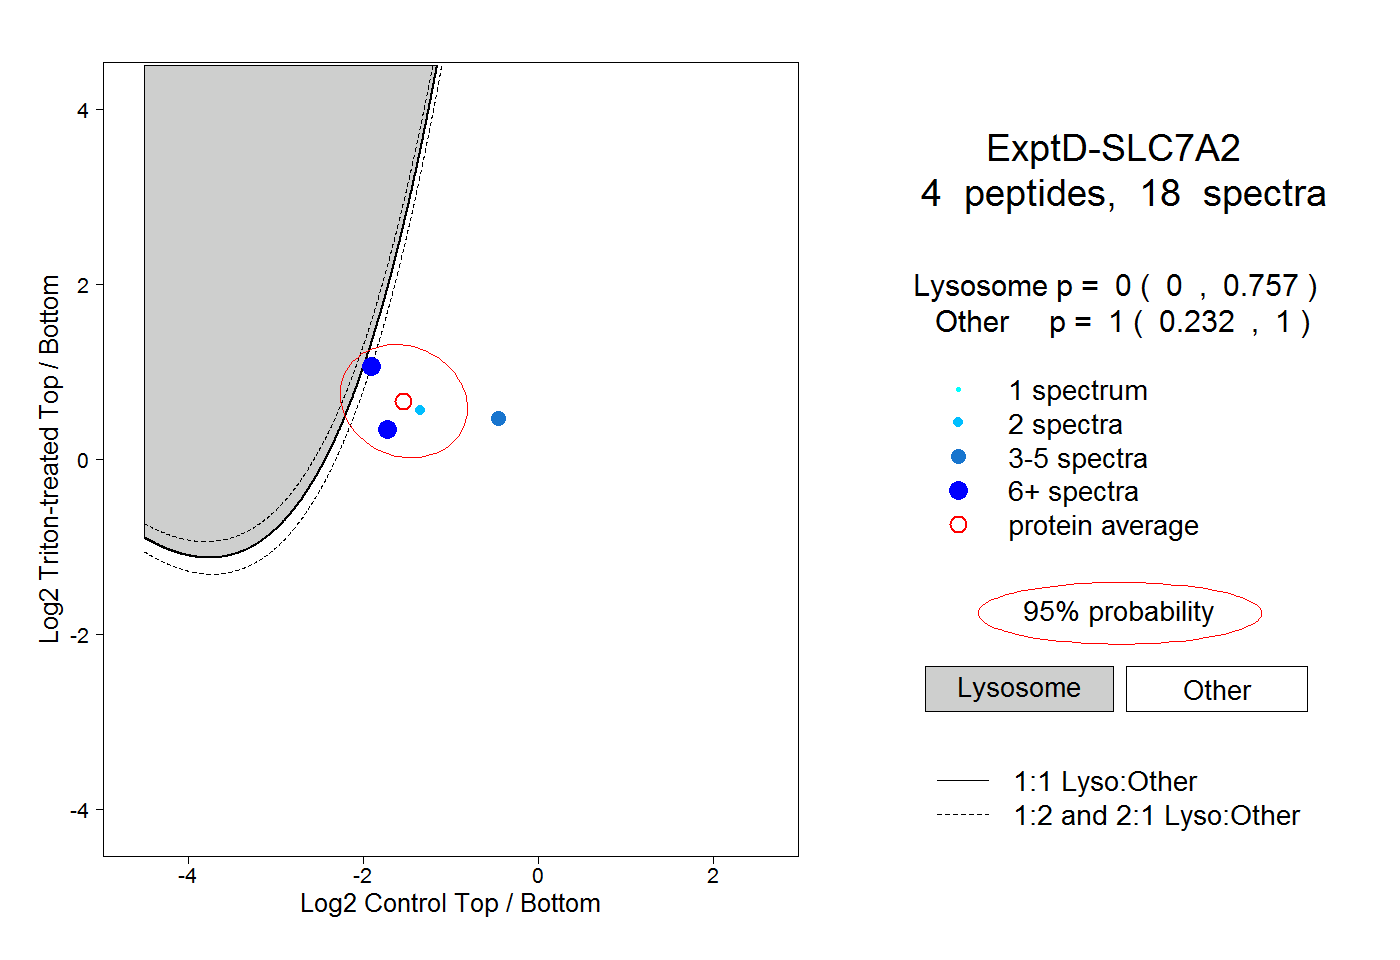 |
0.000 0.000 | 0.757 |
1.000 0.232 | 1.000 |