 10
10peptides
spectra
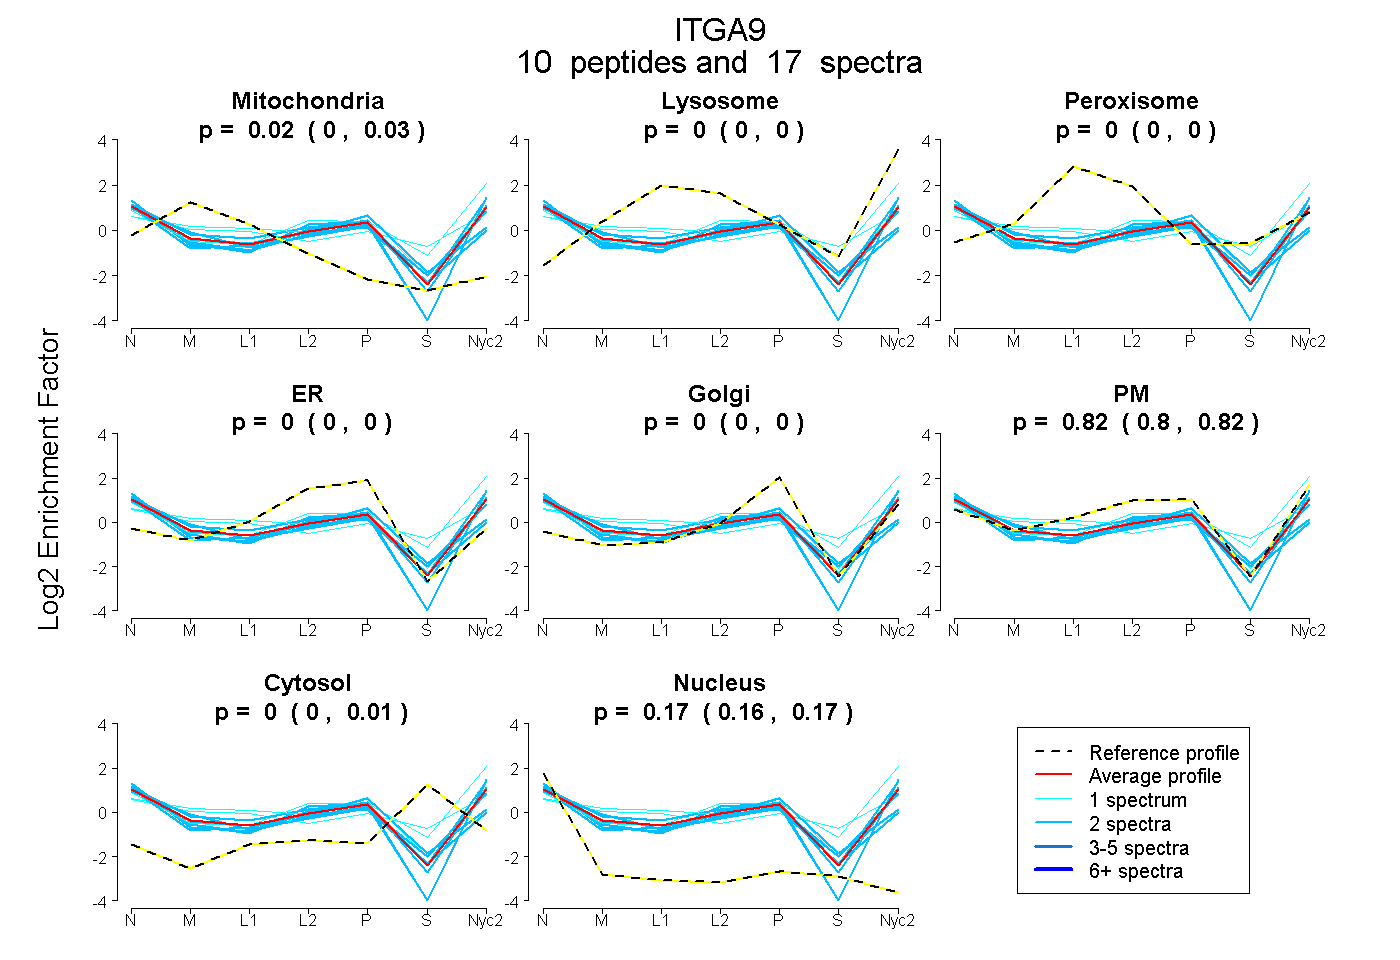
0.004 | 0.027
0.000 | 0.000
0.000 | 0.000
0.000 | 0.000
0.000 | 0.000
0.803 | 0.825
0.000 | 0.006
0.159 | 0.174
| Plot | Mito | Lyso | Perox | ER | Golgi | PM | Cytosol | Nucleus | |||||
| Expt A |
10 peptides |
17 spectra |
|
0.017 0.004 | 0.027 |
0.000 0.000 | 0.000 |
0.000 0.000 | 0.000 |
0.000 0.000 | 0.000 |
0.000 0.000 | 0.000 |
0.815 0.803 | 0.825 |
0.000 0.000 | 0.006 |
0.168 0.159 | 0.174 |
| 2 spectra, VLACAHR | 0.105 | 0.000 | 0.000 | 0.003 | 0.000 | 0.679 | 0.000 | 0.213 | ||
| 2 spectra, SEDCAADLQLR | 0.000 | 0.000 | 0.000 | 0.061 | 0.064 | 0.616 | 0.065 | 0.193 | ||
| 2 spectra, DSSSVIQFMAR | 0.000 | 0.000 | 0.000 | 0.000 | 0.000 | 0.806 | 0.000 | 0.194 | ||
| 2 spectra, ENEEAWDWVQK | 0.000 | 0.000 | 0.000 | 0.000 | 0.006 | 0.812 | 0.000 | 0.182 | ||
| 2 spectra, SPGAVFK | 0.086 | 0.000 | 0.000 | 0.000 | 0.000 | 0.726 | 0.047 | 0.141 | ||
| 1 spectrum, IFQASGK | 0.000 | 0.021 | 0.000 | 0.000 | 0.000 | 0.793 | 0.186 | 0.000 | ||
| 2 spectra, LLLSSVDEK | 0.025 | 0.000 | 0.000 | 0.000 | 0.000 | 0.859 | 0.000 | 0.116 | ||
| 1 spectrum, MLIPCYEEYK | 0.190 | 0.000 | 0.000 | 0.000 | 0.096 | 0.686 | 0.028 | 0.000 | ||
| 2 spectra, ELPDLTPVLR | 0.000 | 0.000 | 0.000 | 0.000 | 0.000 | 0.845 | 0.000 | 0.155 | ||
| 1 spectrum, ELFFINMWQK | 0.162 | 0.029 | 0.022 | 0.000 | 0.000 | 0.531 | 0.256 | 0.000 |
| Plot | Lyso | Other | |||||||||||
| Expt C |
10 peptides |
20 spectra |
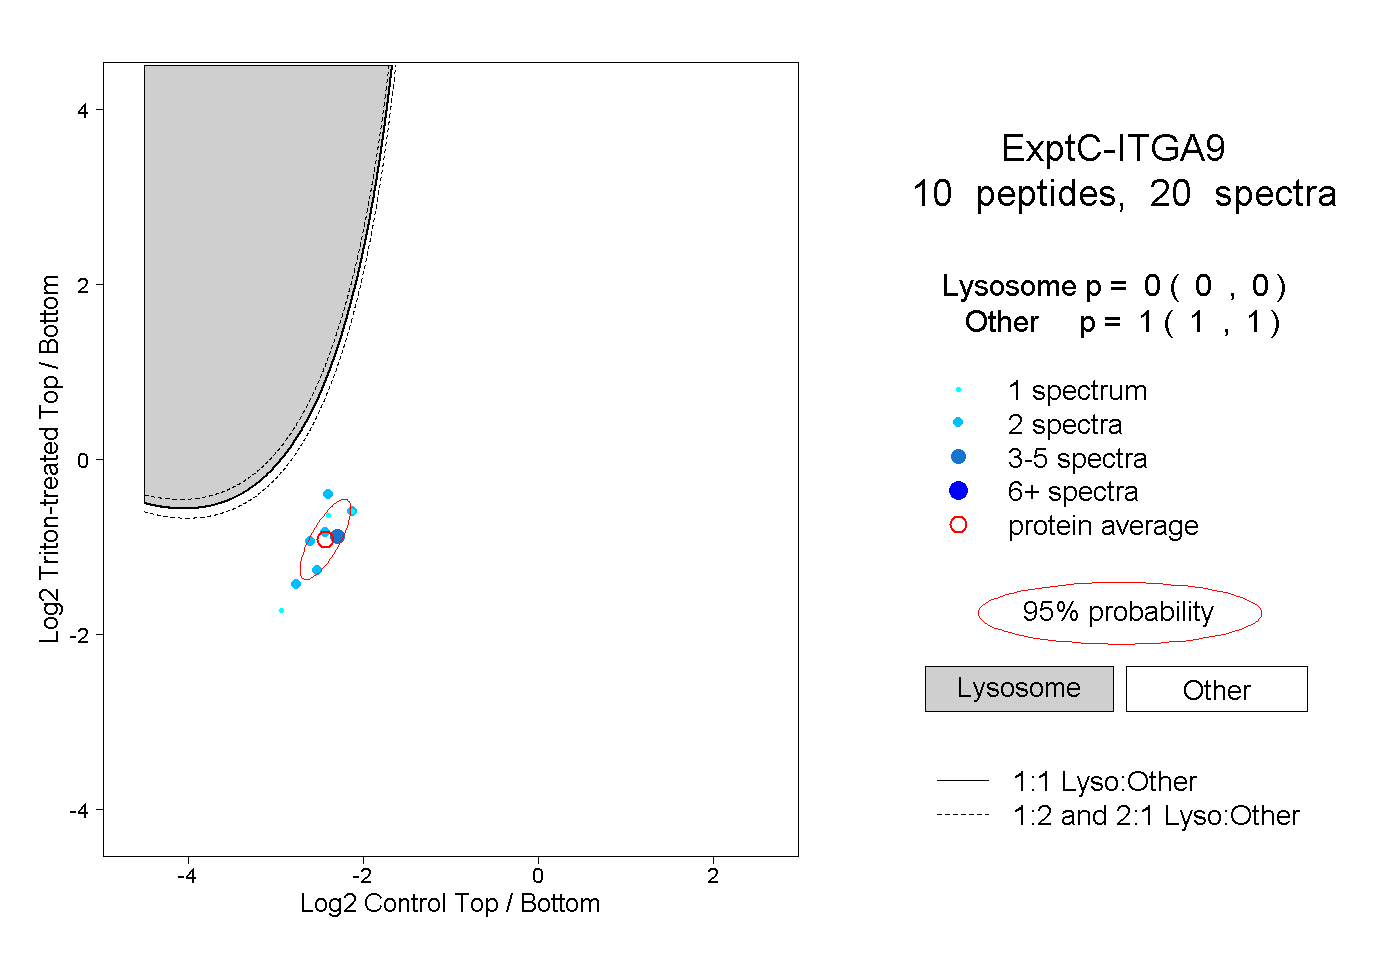 |
0.000 0.000 | 0.000 |
1.000 1.000 | 1.000 |