 3
3peptides
spectra
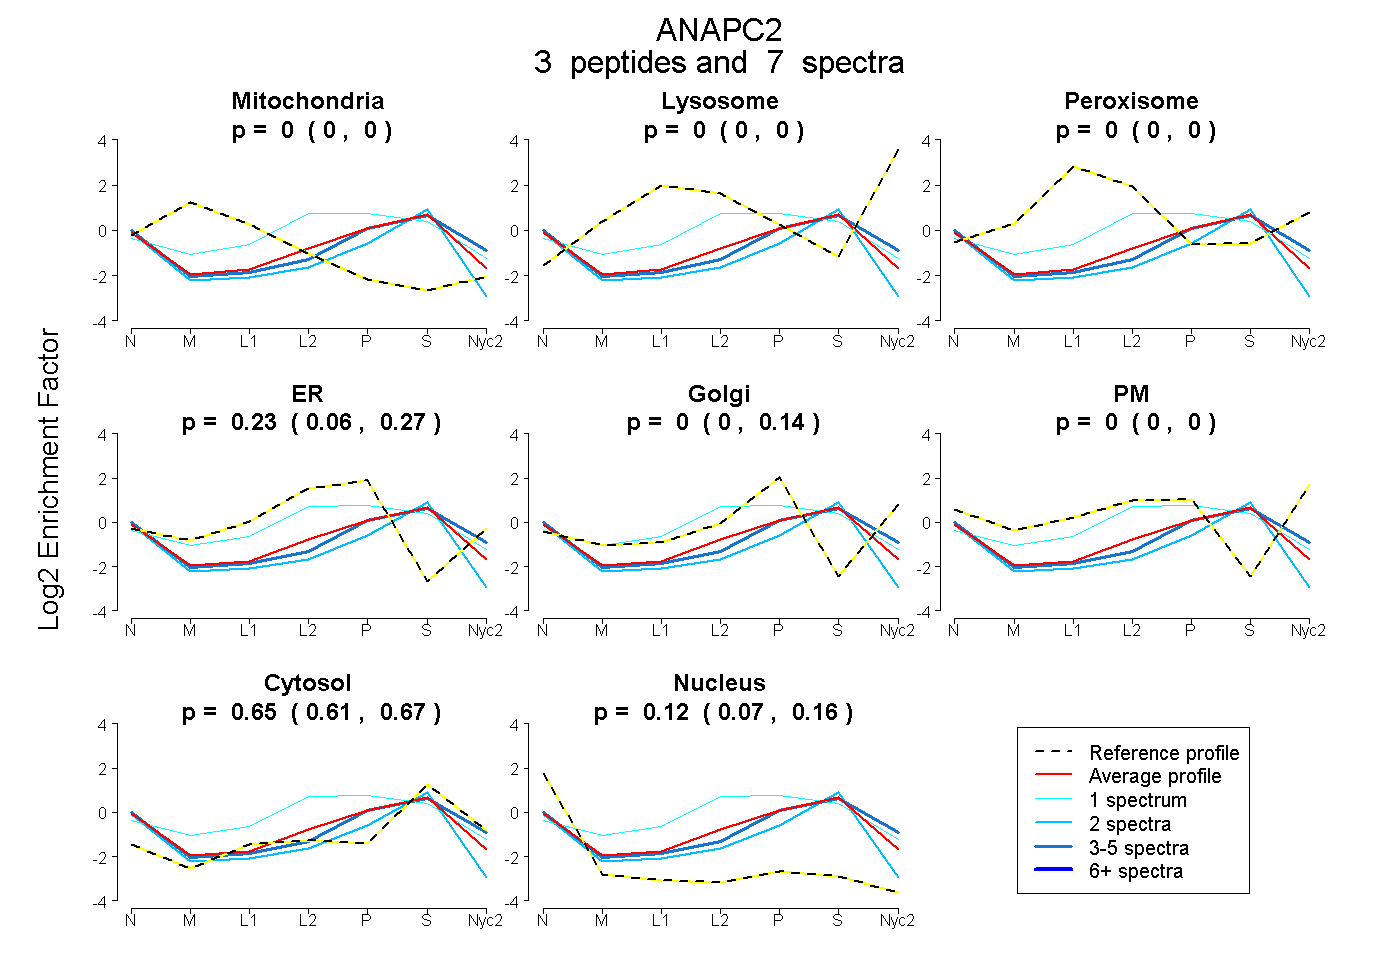
0.000 | 0.000
0.000 | 0.000
0.000 | 0.000
0.059 | 0.269
0.000 | 0.135
0.000 | 0.000
0.614 | 0.670
0.071 | 0.164
| Plot | Mito | Lyso | Perox | ER | Golgi | PM | Cytosol | Nucleus | |||||
| Expt A |
3 peptides |
7 spectra |
|
0.000 0.000 | 0.000 |
0.000 0.000 | 0.000 |
0.000 0.000 | 0.000 |
0.228 0.059 | 0.269 |
0.000 0.000 | 0.135 |
0.000 0.000 | 0.000 |
0.649 0.614 | 0.670 |
0.123 0.071 | 0.164 |
| 1 spectrum, LEELITVFR | 0.000 | 0.000 | 0.074 | 0.450 | 0.000 | 0.000 | 0.475 | 0.000 | ||
| 2 spectra, EEPPGTFSVIEEERPQDR | 0.000 | 0.000 | 0.000 | 0.030 | 0.000 | 0.000 | 0.688 | 0.282 | ||
| 4 spectra, GVLFFSTPR | 0.000 | 0.000 | 0.000 | 0.000 | 0.259 | 0.000 | 0.637 | 0.103 |
| Plot | Mito | Lyso or Perox | ER | Golgi | PM | Cytosol | Nucleus | ||||||
| Expt B |
1 peptide |
1 spectrum |
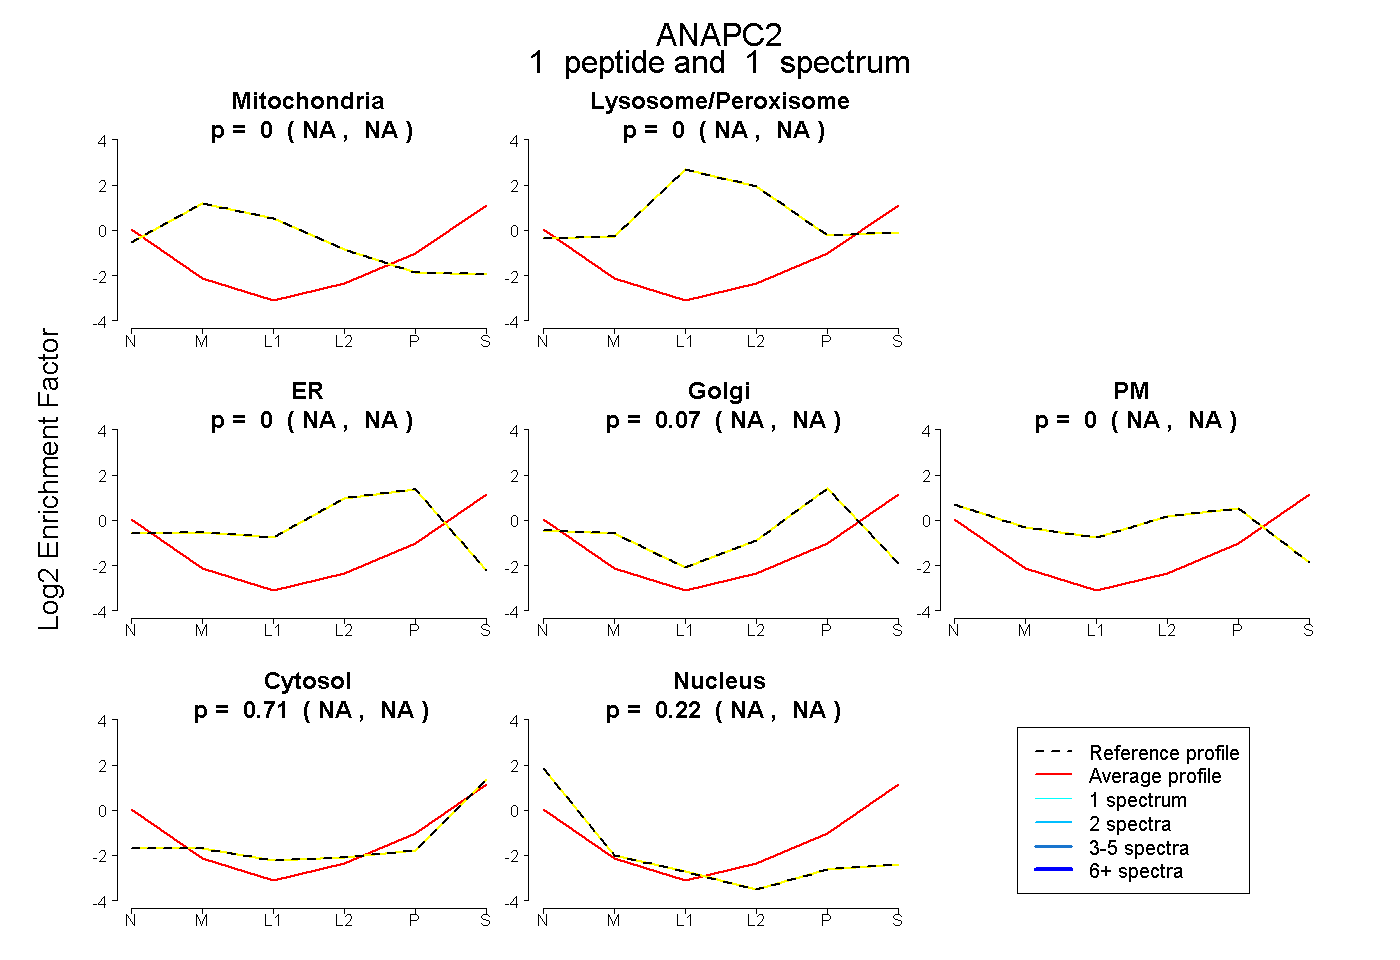 |
0.000 NA | NA |
0.000 NA | NA |
0.000 NA | NA |
0.069 NA | NA |
0.000 NA | NA |
0.709 NA | NA |
0.221 NA | NA |