 9
9peptides
spectra
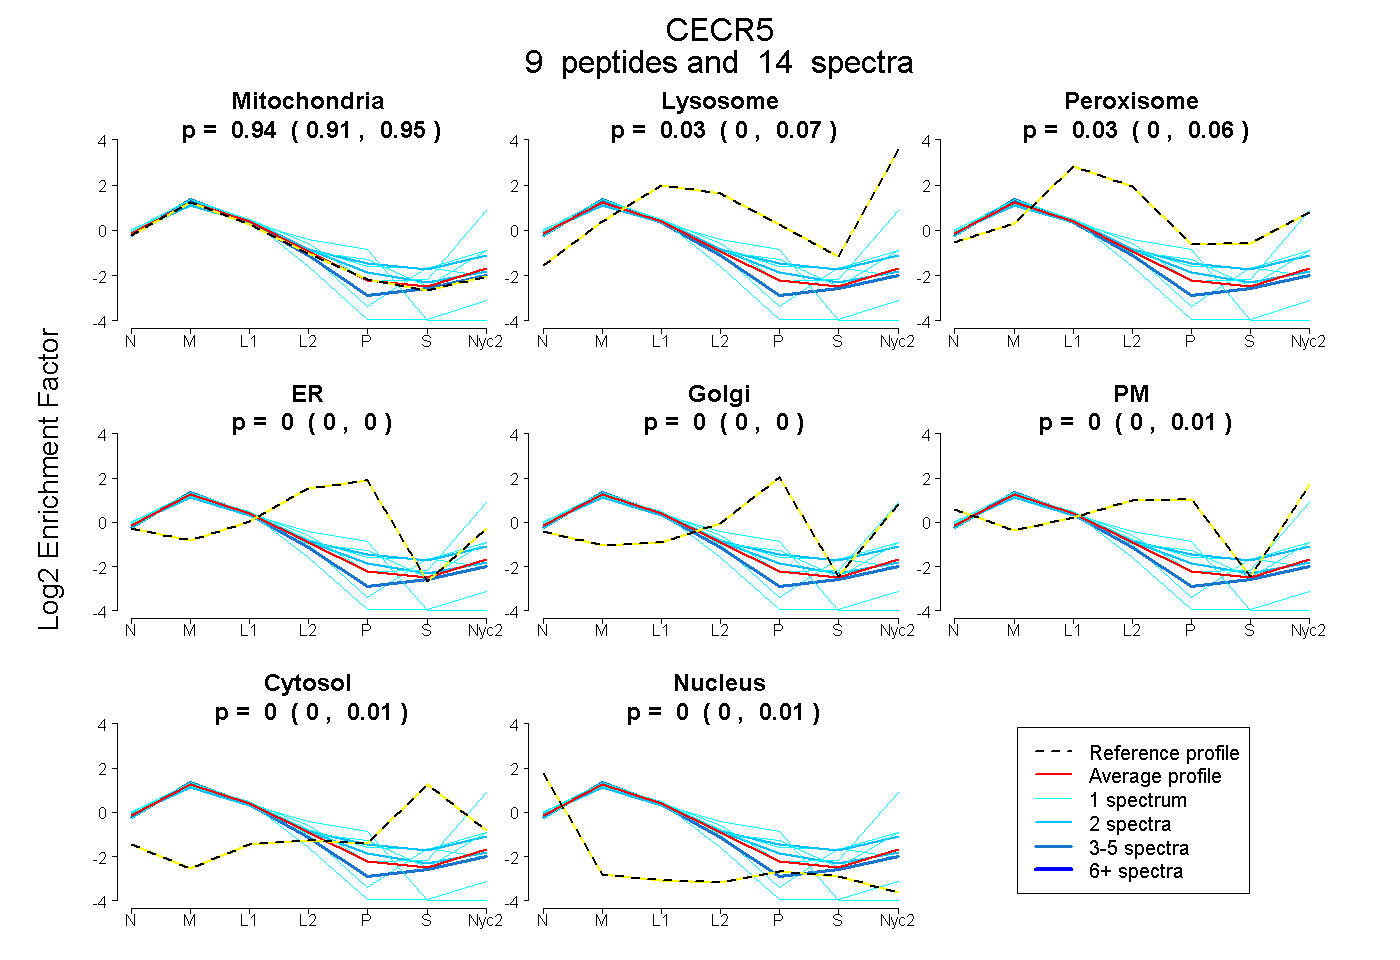
0.909 | 0.955
0.000 | 0.072
0.000 | 0.059
0.000 | 0.000
0.000 | 0.000
0.000 | 0.014
0.000 | 0.009
0.000 | 0.007
3peptides
spectra
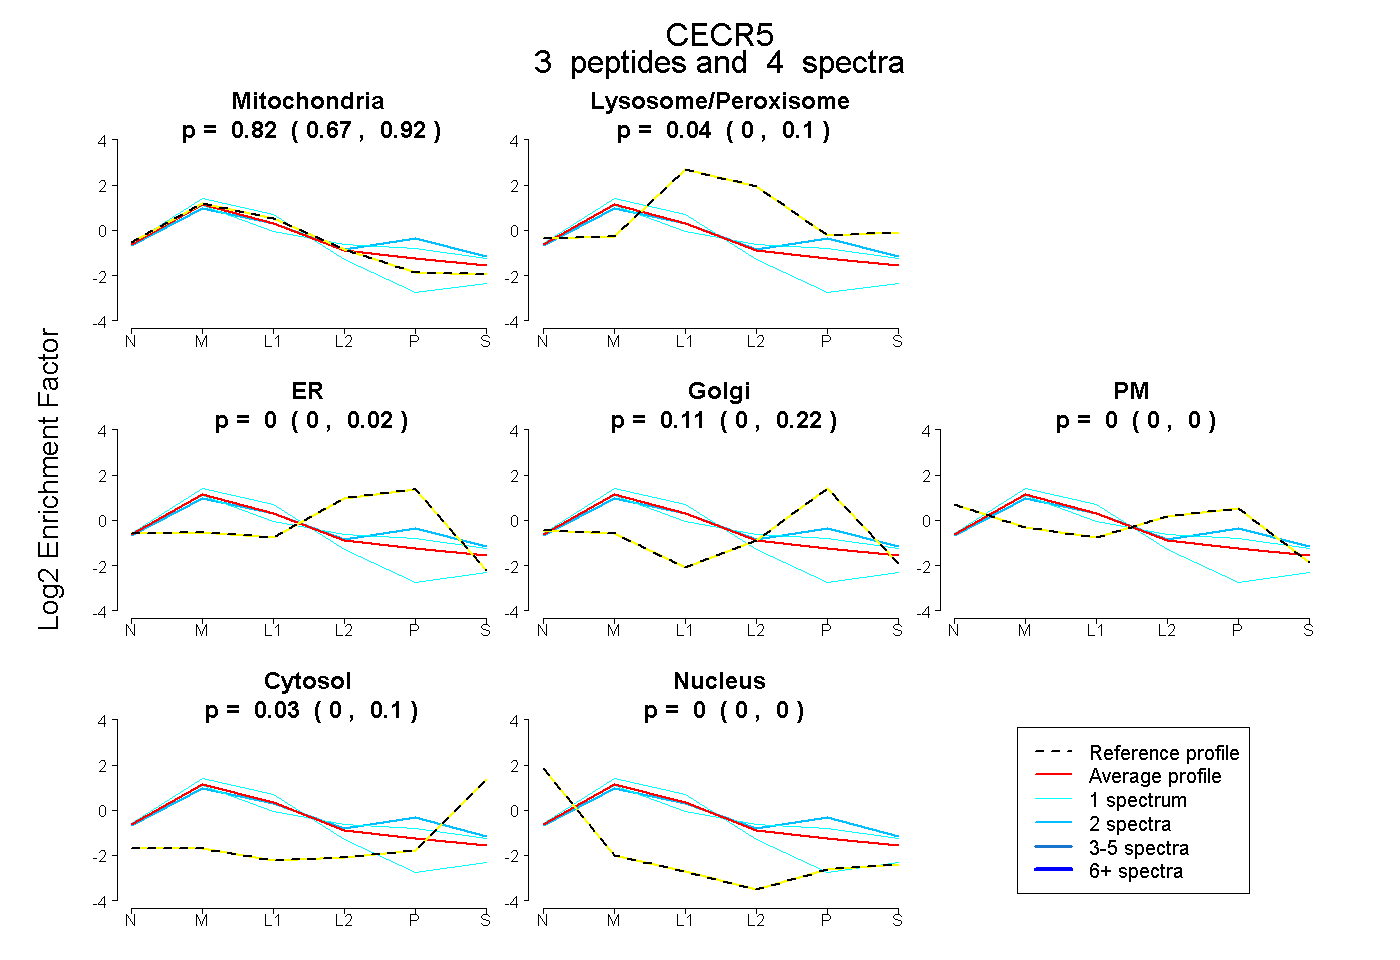
0.667 | 0.920
0.000 | 0.101
0.000 | 0.016
0.000 | 0.215
0.000 | 0.000
0.000 | 0.098
0.000 | 0.000
13peptides
spectra

0.000 | 0.000
1.000 | 1.000
5peptides
spectra

0.000 | 0.000
1.000 | 1.000