 12
12peptides
spectra

0.000 | 0.000
0.000 | 0.012
0.005 | 0.036
0.000 | 0.000
0.000 | 0.034
0.090 | 0.144
0.829 | 0.848
0.000 | 0.000
| Plot | Mito | Lyso | Perox | ER | Golgi | PM | Cytosol | Nucleus | |||||
| Expt A |
12 peptides |
20 spectra |
|
0.000 0.000 | 0.000 |
0.000 0.000 | 0.012 |
0.023 0.005 | 0.036 |
0.000 0.000 | 0.000 |
0.011 0.000 | 0.034 |
0.127 0.090 | 0.144 |
0.840 0.829 | 0.848 |
0.000 0.000 | 0.000 |
| 1 spectrum, YELADAFNK | 0.000 | 0.000 | 0.000 | 0.000 | 0.026 | 0.000 | 0.972 | 0.002 | ||
| 1 spectrum, VSEDLVSIHLPLSR | 0.000 | 0.000 | 0.000 | 0.129 | 0.146 | 0.000 | 0.725 | 0.000 | ||
| 3 spectra, APEEEVAFDFYHK | 0.000 | 0.000 | 0.000 | 0.000 | 0.053 | 0.000 | 0.947 | 0.000 | ||
| 2 spectra, EYISDDHER | 0.000 | 0.029 | 0.000 | 0.000 | 0.050 | 0.053 | 0.868 | 0.000 | ||
| 3 spectra, WIQTVLAR | 0.000 | 0.055 | 0.000 | 0.000 | 0.000 | 0.193 | 0.752 | 0.000 | ||
| 2 spectra, TLAGLHVR | 0.080 | 0.000 | 0.118 | 0.000 | 0.010 | 0.181 | 0.611 | 0.000 | ||
| 1 spectrum, TTCPQVLIQK | 0.000 | 0.033 | 0.000 | 0.000 | 0.000 | 0.250 | 0.717 | 0.000 | ||
| 1 spectrum, YILISKPLVWTER | 0.052 | 0.088 | 0.000 | 0.000 | 0.000 | 0.000 | 0.860 | 0.000 | ||
| 1 spectrum, DQDLIK | 0.000 | 0.000 | 0.007 | 0.000 | 0.000 | 0.192 | 0.801 | 0.000 | ||
| 1 spectrum, ALMQFAVAQR | 0.000 | 0.012 | 0.010 | 0.040 | 0.000 | 0.000 | 0.939 | 0.000 | ||
| 2 spectra, TVVQLCGHSLETK | 0.000 | 0.000 | 0.078 | 0.136 | 0.000 | 0.000 | 0.786 | 0.000 | ||
| 2 spectra, AQFLEGFR | 0.000 | 0.080 | 0.000 | 0.000 | 0.000 | 0.000 | 0.920 | 0.000 |
| Plot | Mito | Lyso or Perox | ER | Golgi | PM | Cytosol | Nucleus | ||||||
| Expt B |
1 peptide |
1 spectrum |
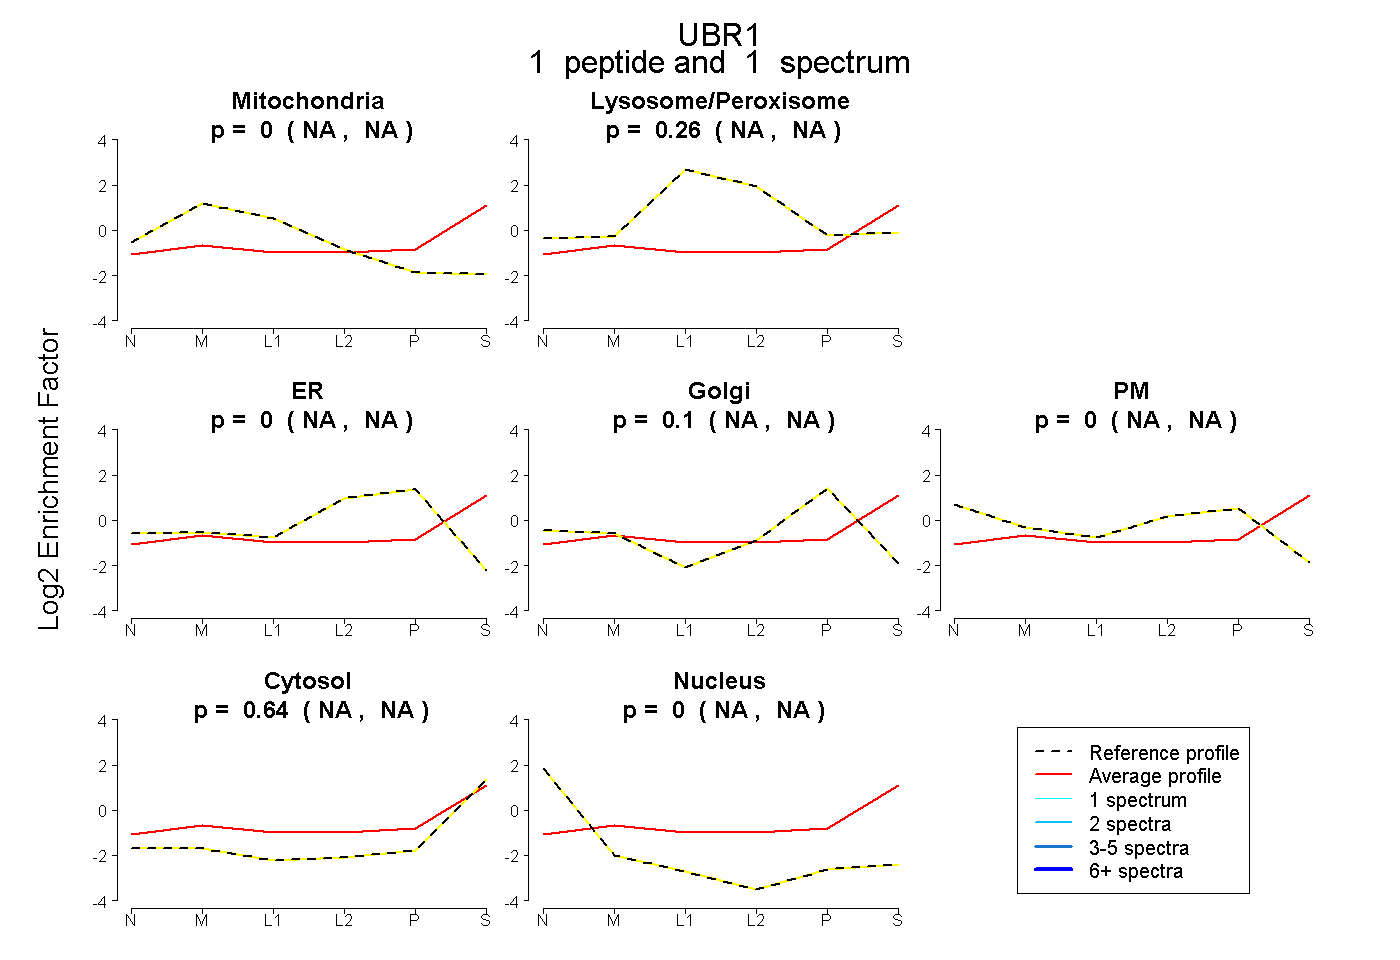 |
0.000 NA | NA |
0.264 NA | NA |
0.000 NA | NA |
0.097 NA | NA |
0.000 NA | NA |
0.640 NA | NA |
0.000 NA | NA |
|||
| Plot | Lyso | Other | |||||||||||
| Expt C |
4 peptides |
7 spectra |
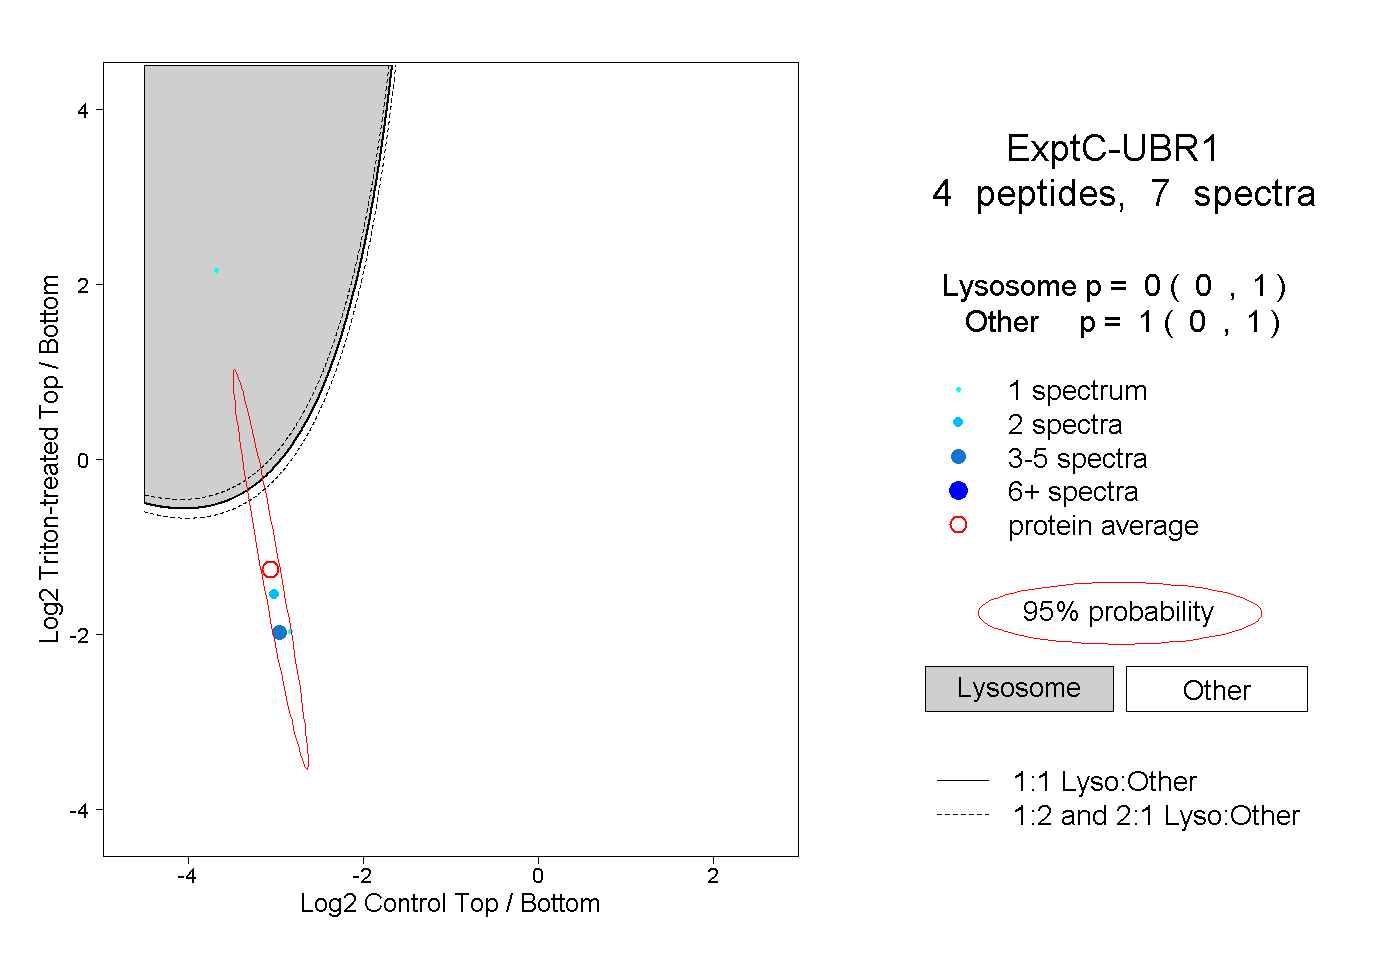 |
0.000 0.000 | 1.000 |
1.000 0.000 | 1.000 |