22
22peptides
spectra
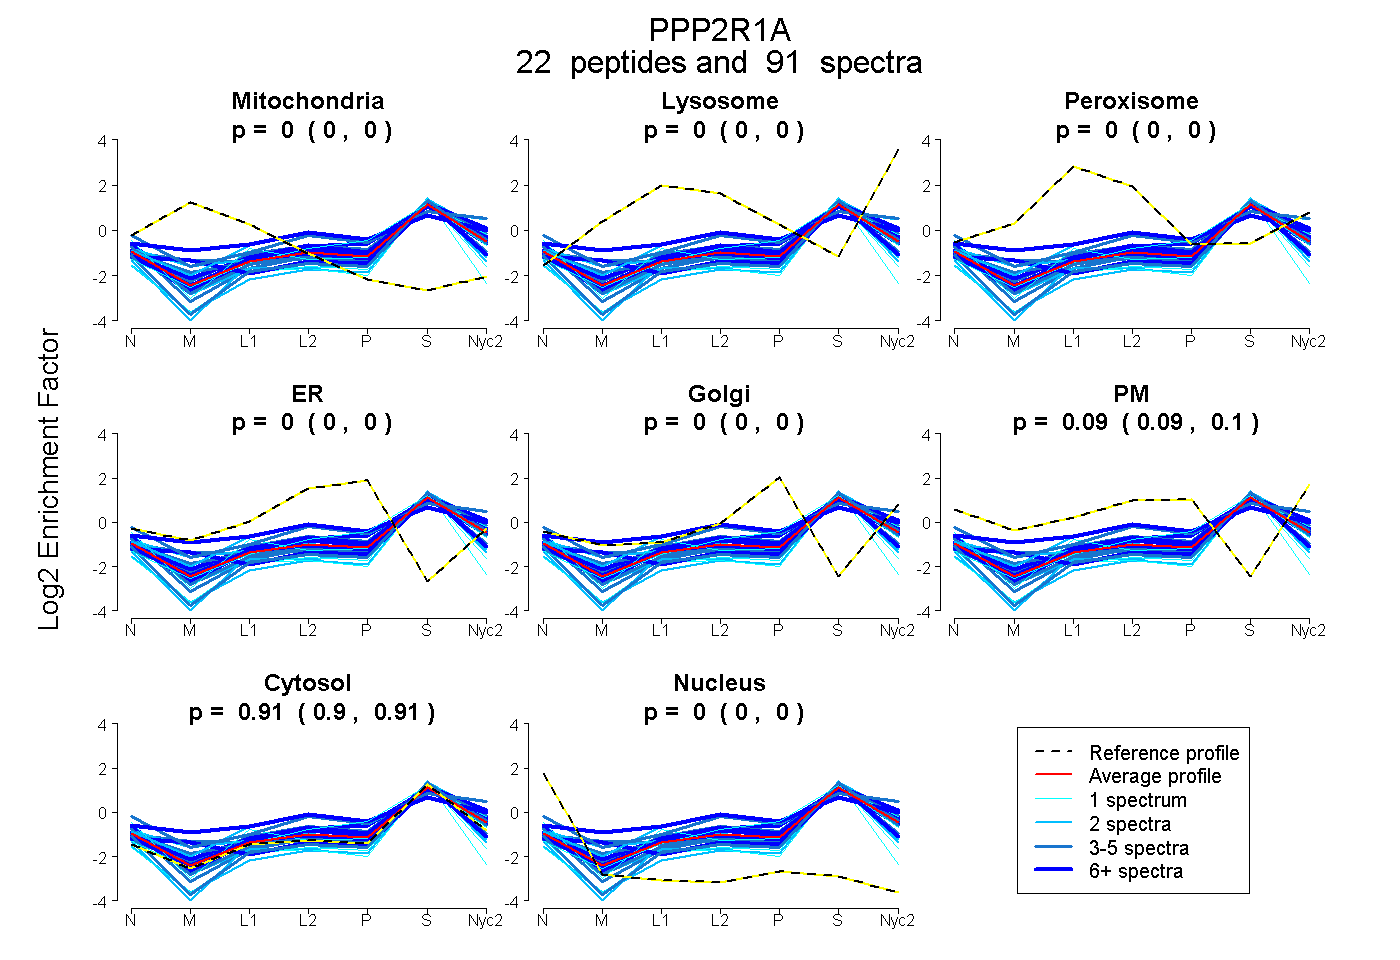
0.000 | 0.000
0.000 | 0.000
0.000 | 0.000
0.000 | 0.000
0.000 | 0.000
0.090 | 0.096
0.903 | 0.909
0.000 | 0.000
12peptides
spectra
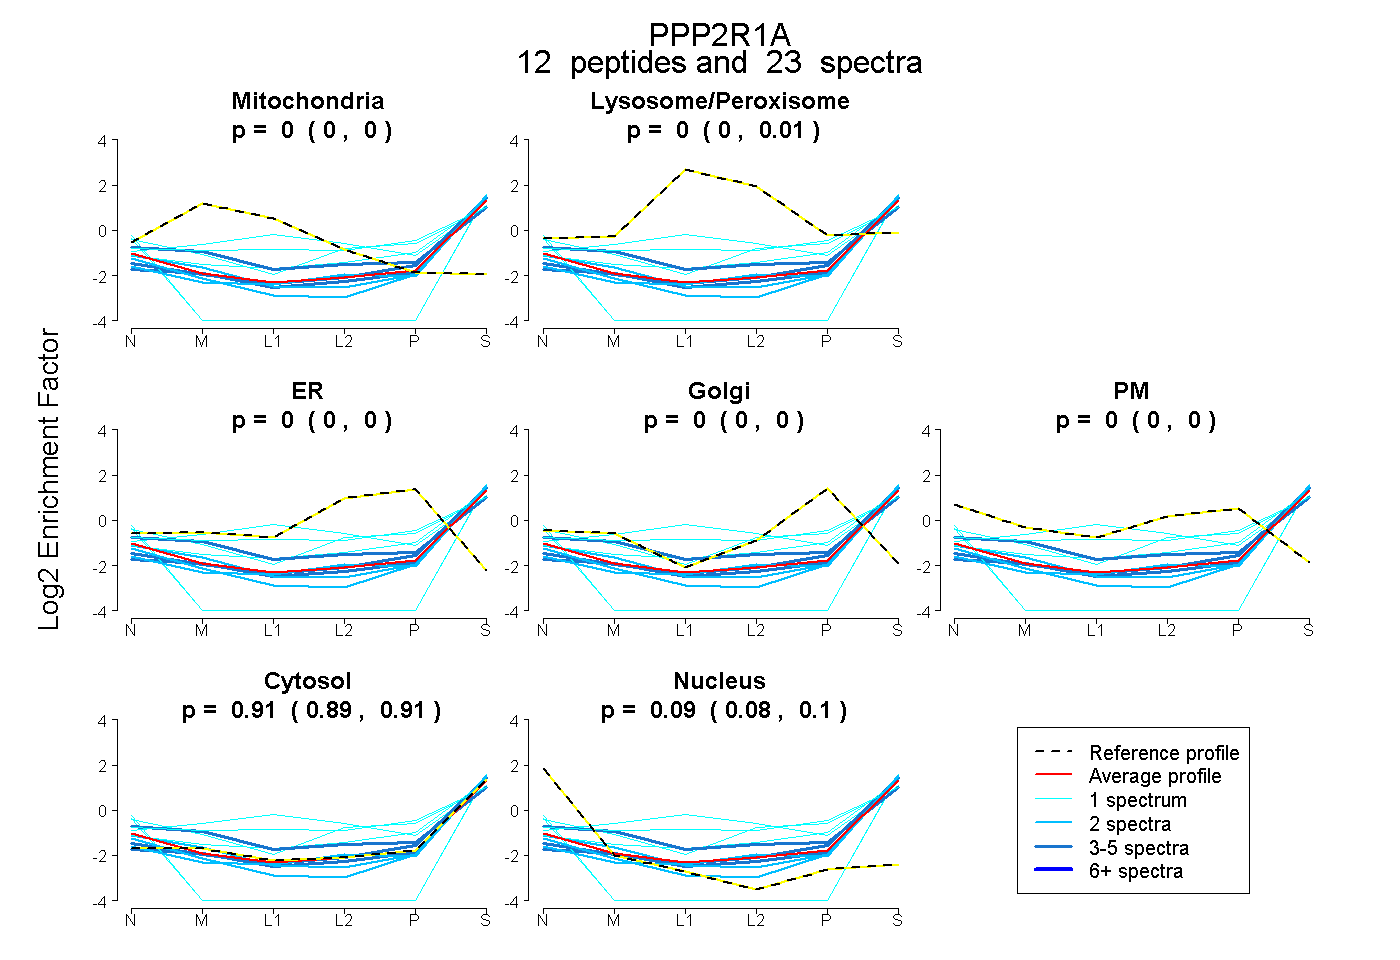
0.000 | 0.000
0.000 | 0.013
0.000 | 0.000
0.000 | 0.000
0.000 | 0.000
0.894 | 0.914
0.080 | 0.099