 2
2peptides
spectra
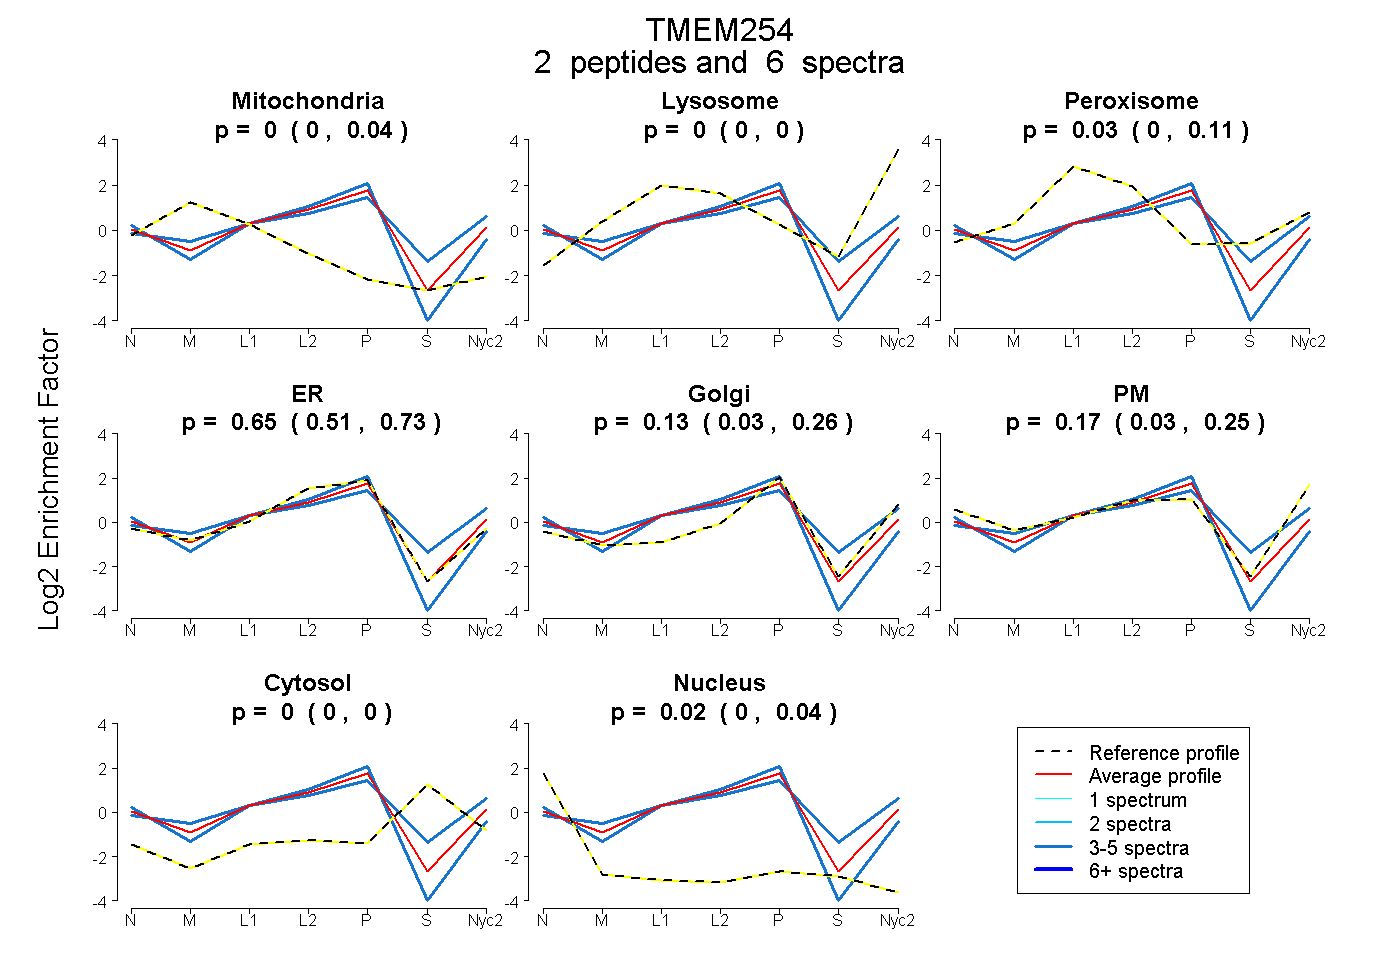
0.000 | 0.039
0.000 | 0.000
0.000 | 0.108
0.515 | 0.733
0.032 | 0.257
0.032 | 0.251
0.000 | 0.000
0.000 | 0.041
1peptide
spectrum
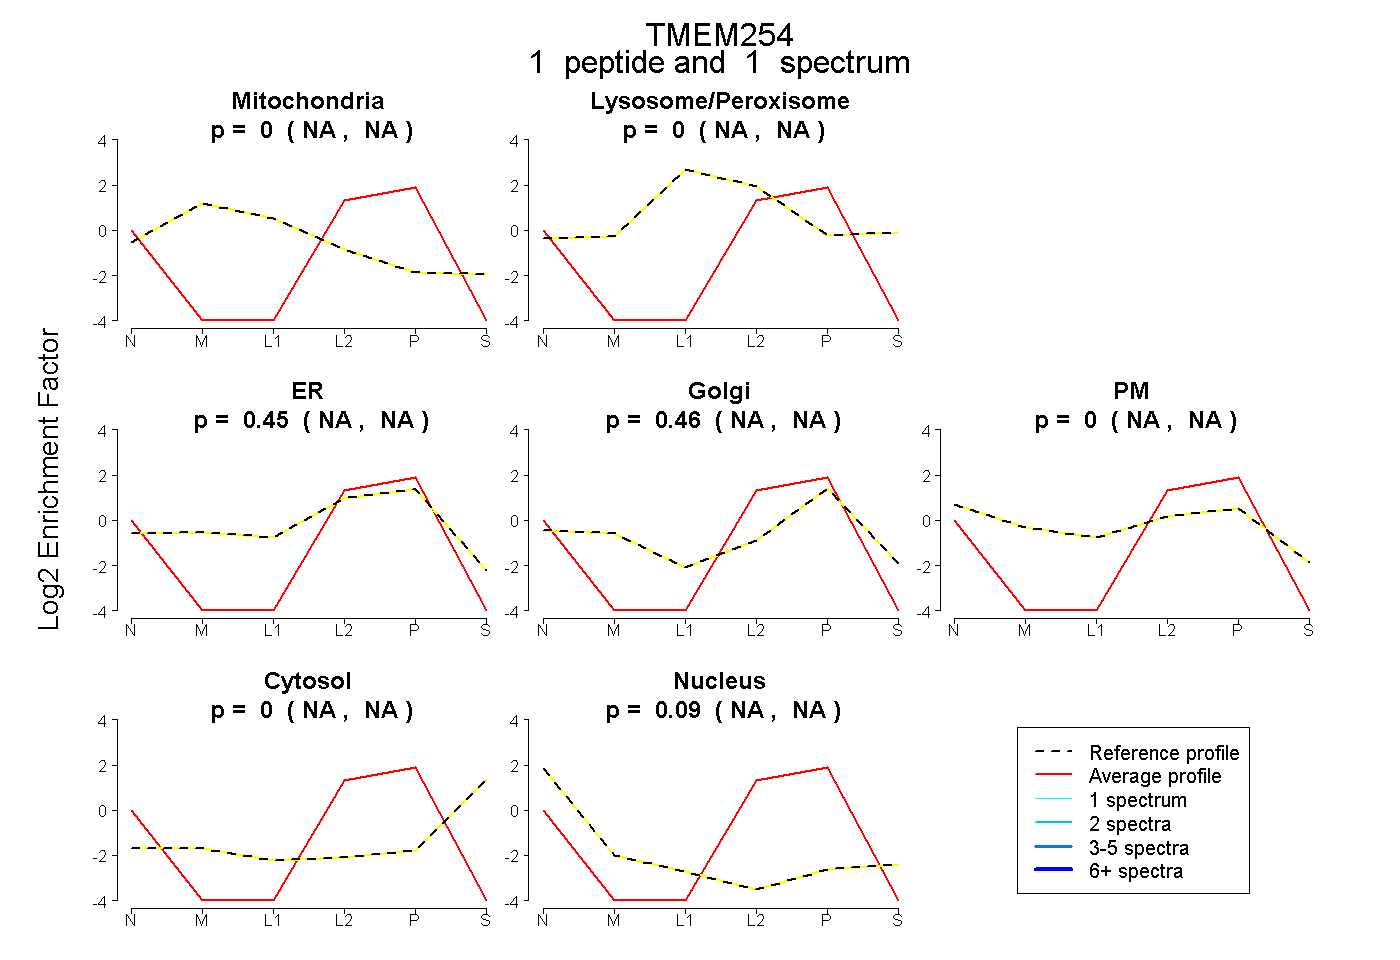
NA | NA
NA | NA
NA | NA
NA | NA
NA | NA
NA | NA
NA | NA
1peptide
spectra
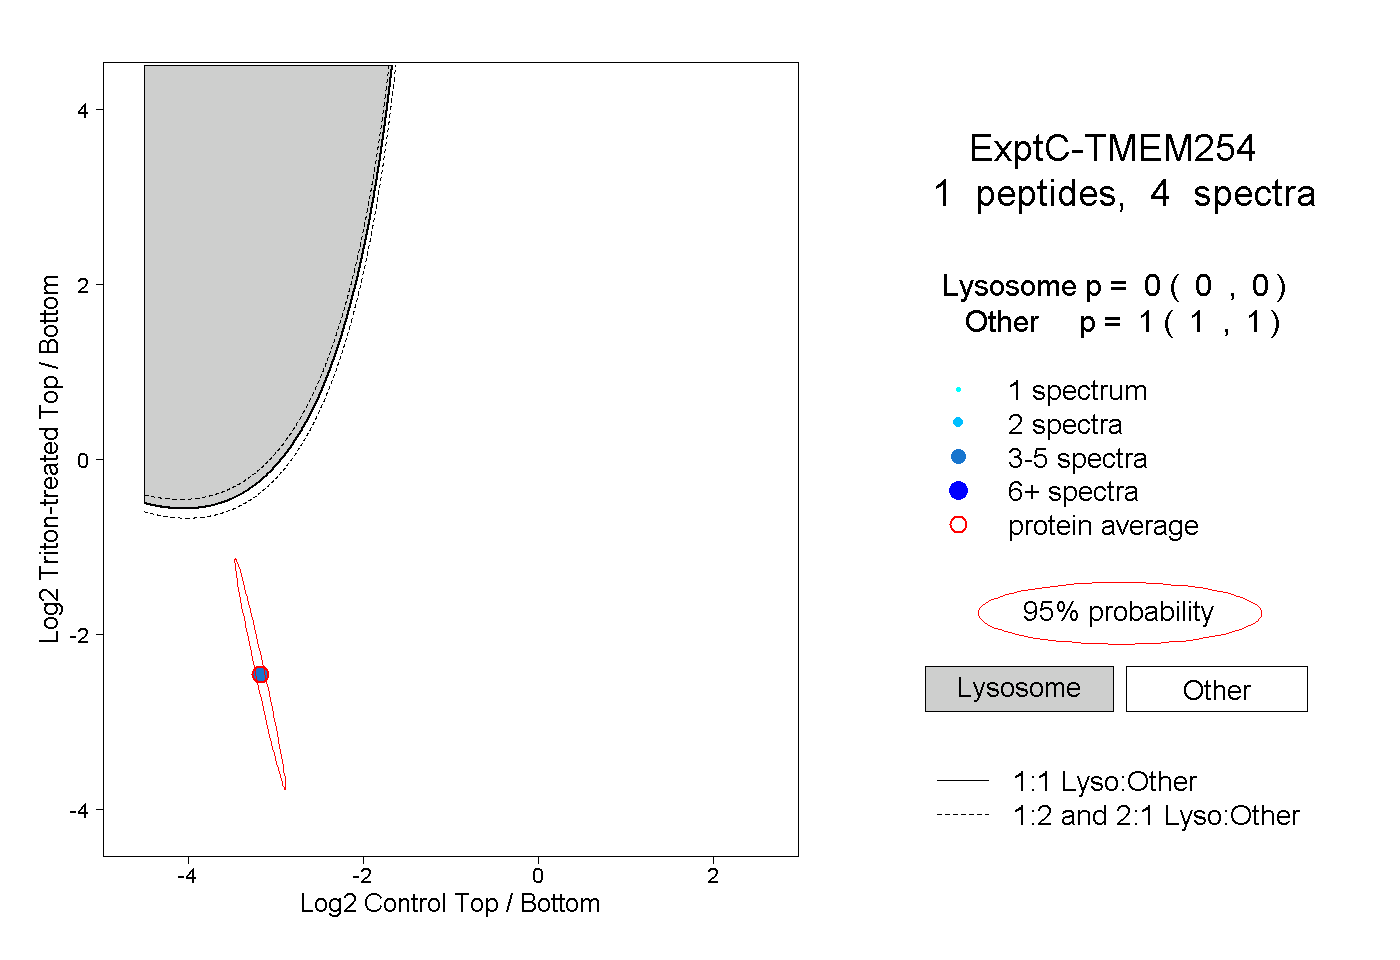
0.000 | 0.000
1.000 | 1.000