 2
2peptides
spectra
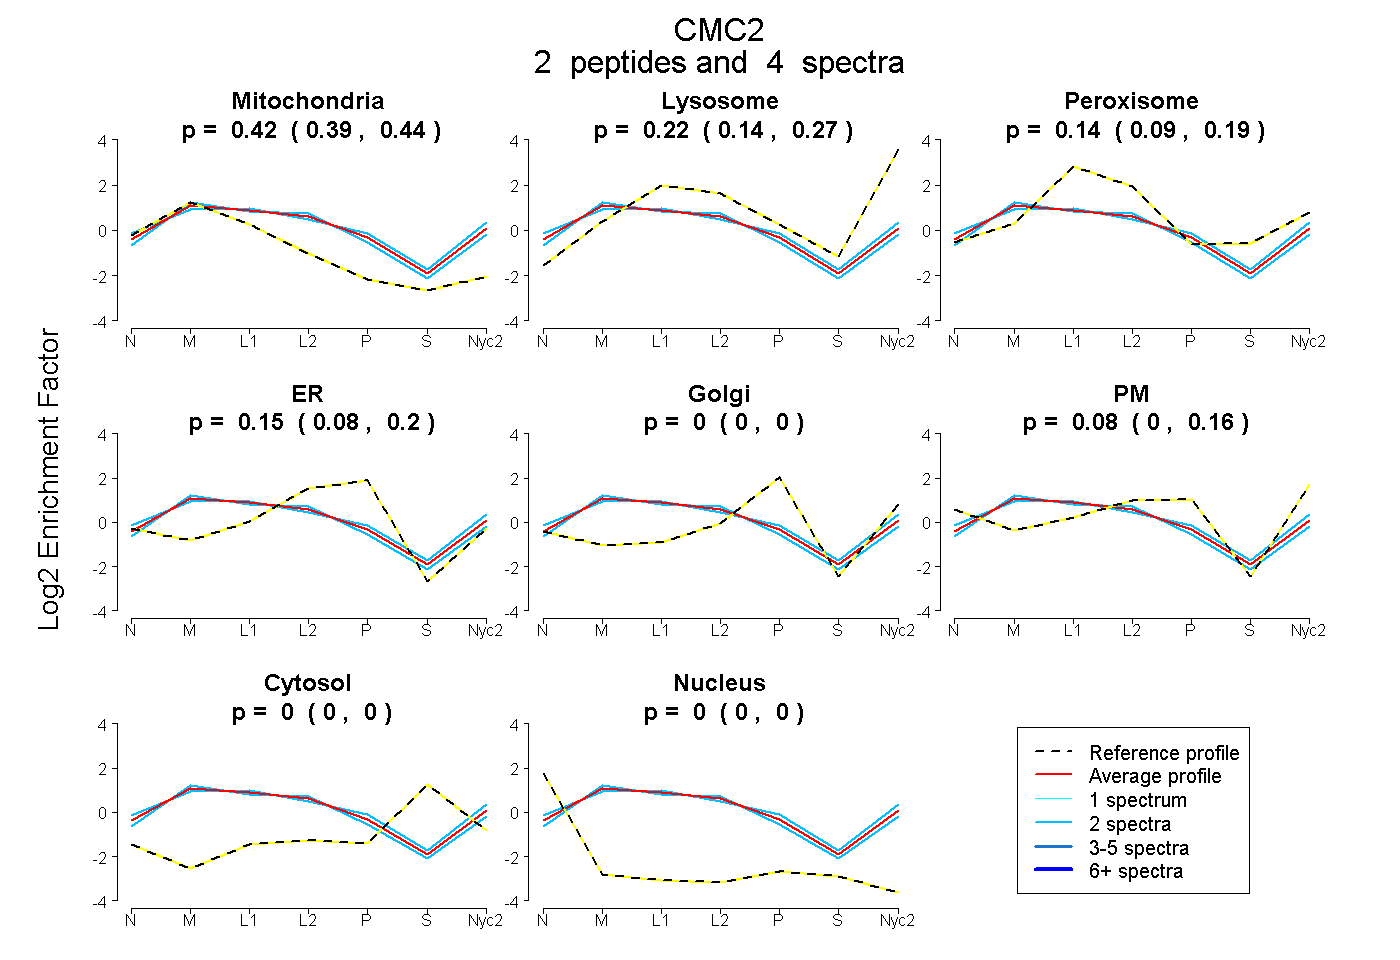
0.390 | 0.441
0.145 | 0.267
0.090 | 0.188
0.080 | 0.201
0.000 | 0.000
0.000 | 0.164
0.000 | 0.000
0.000 | 0.000
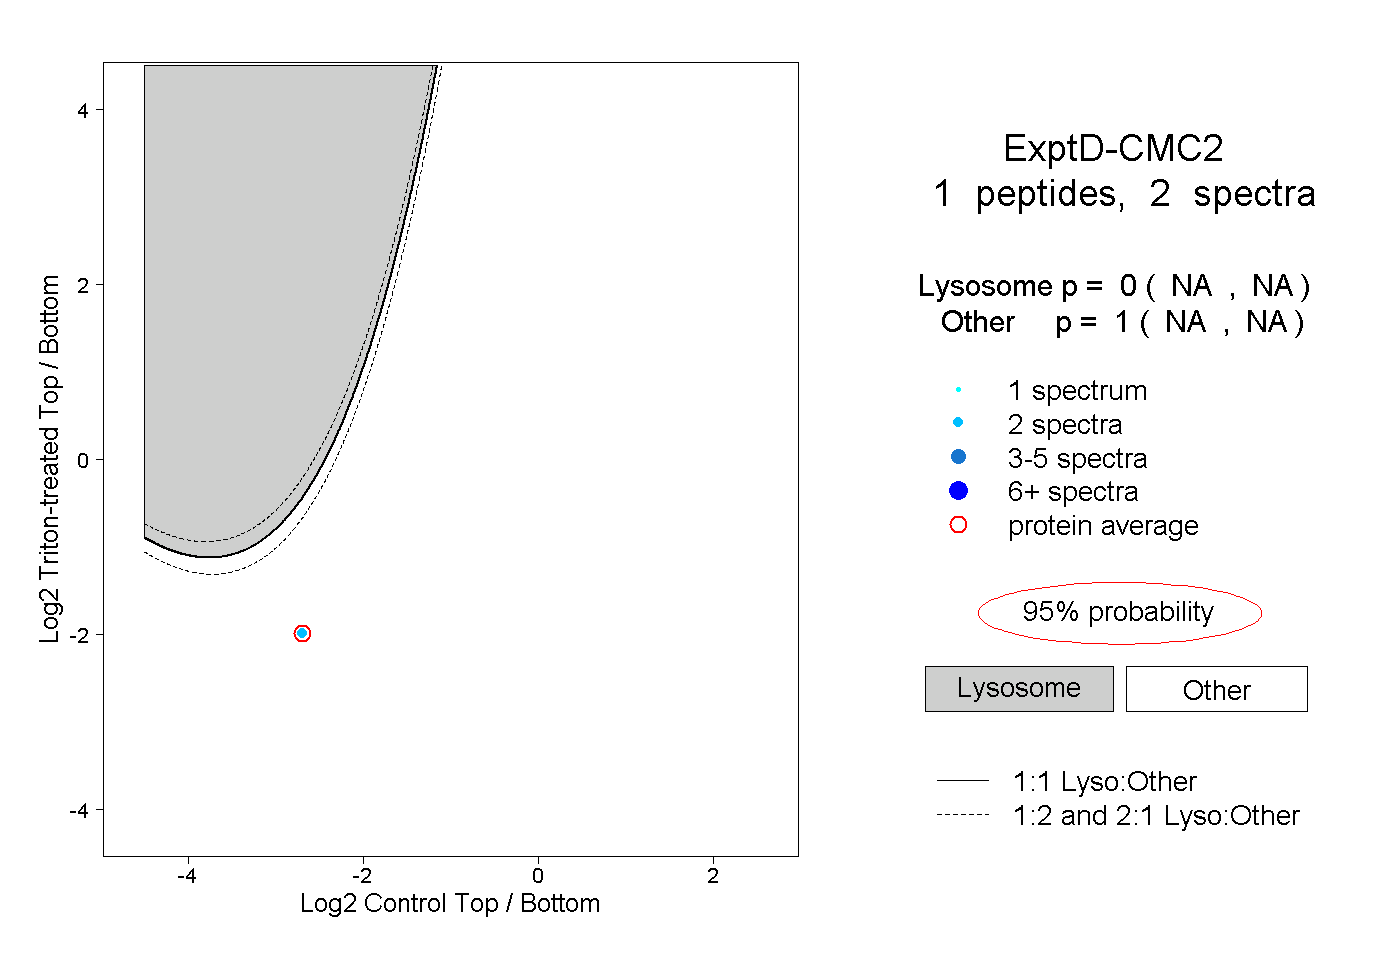
1peptide
spectrum

NA | NA
NA | NA
NA | NA
NA | NA
NA | NA
NA | NA
NA | NA
4peptides
spectra

0.000 | 0.000
1.000 | 1.000
1peptide
spectra
NA | NA
NA | NA