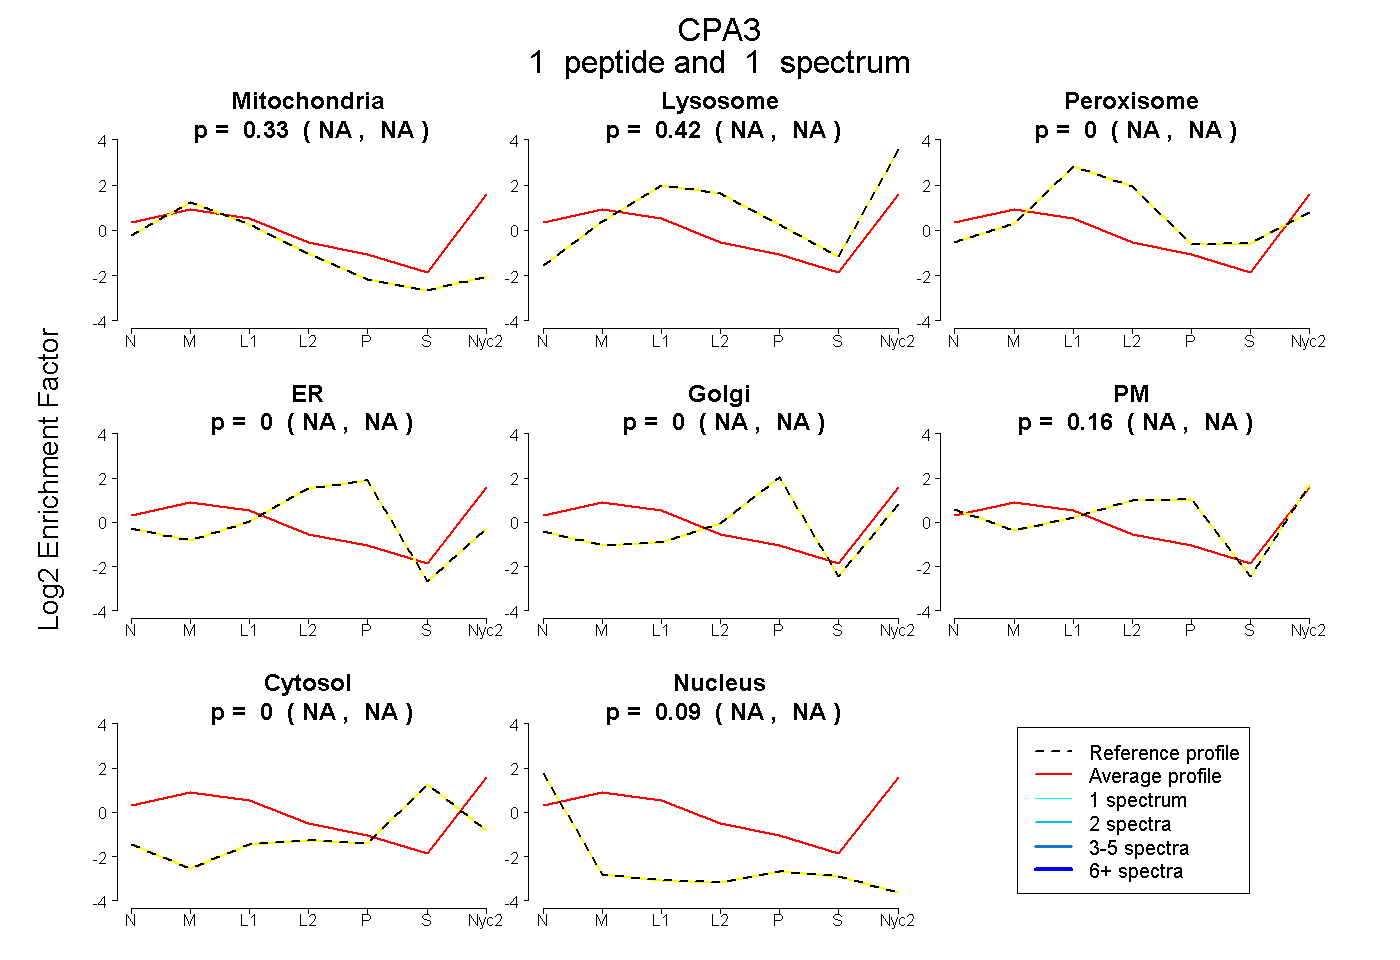
 1
1peptide
spectrum
NA | NA
NA | NA
NA | NA
NA | NA
NA | NA
NA | NA
NA | NA
NA | NA
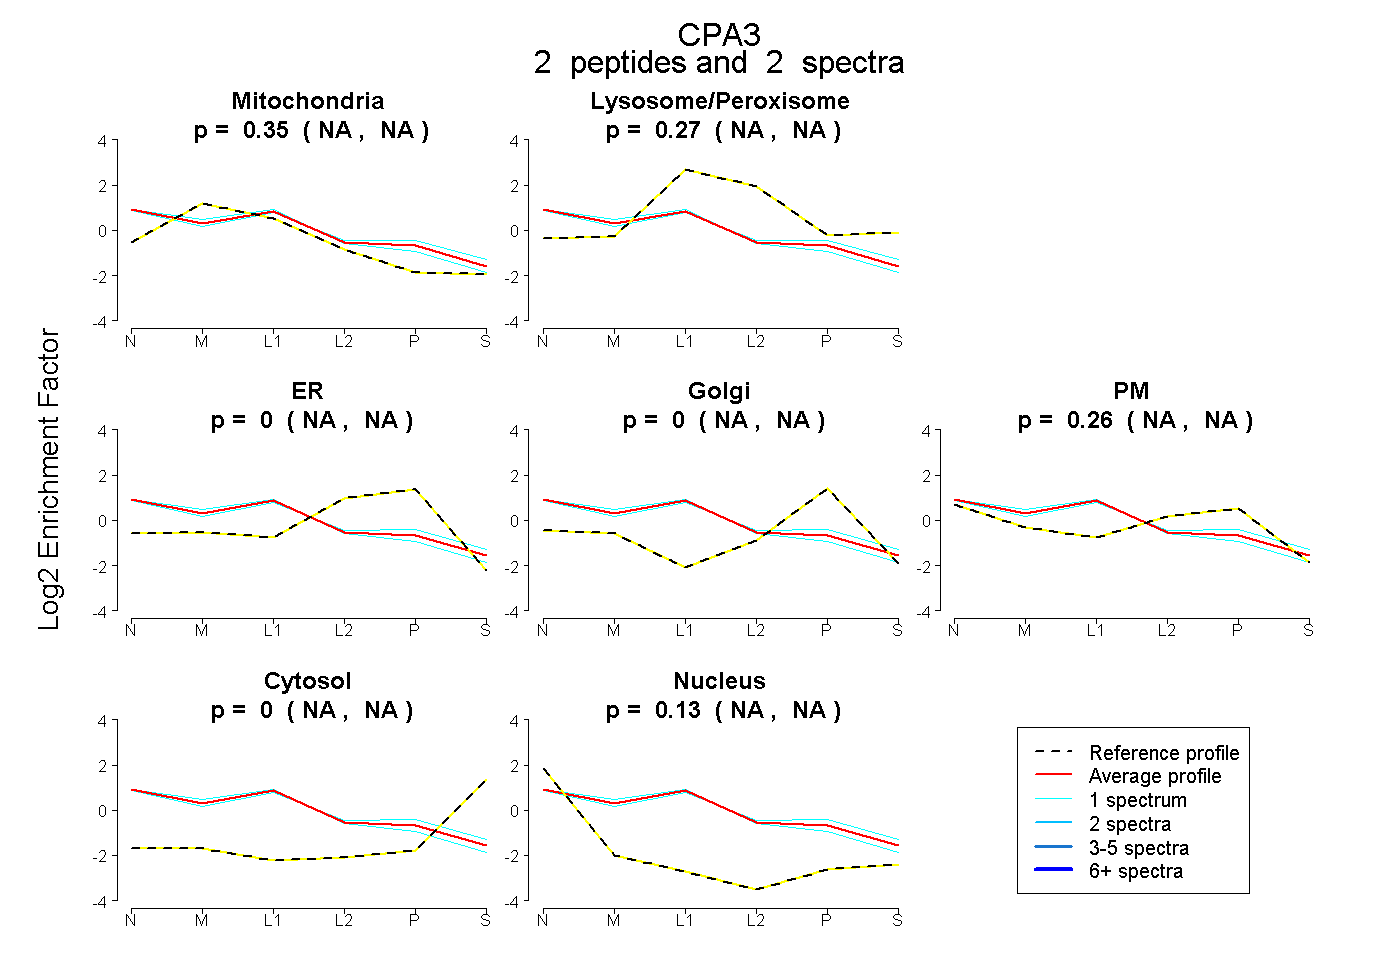
2peptides
spectra
NA | NA
NA | NA
NA | NA
NA | NA
NA | NA
NA | NA
NA | NA
| Plot | Mito | Lyso | Perox | ER | Golgi | PM | Cytosol | Nucleus | |||||
| Expt A |
1 peptide |
1 spectrum |
|
0.329 NA | NA |
0.424 NA | NA |
0.000 NA | NA |
0.000 NA | NA |
0.000 NA | NA |
0.156 NA | NA |
0.000 NA | NA |
0.091 NA | NA |
||
| Plot | Mito | Lyso or Perox | ER | Golgi | PM | Cytosol | Nucleus | ||||||
| Expt B |
2 peptides |
2 spectra |
|
0.347 NA | NA |
0.266 NA | NA |
0.000 NA | NA |
0.000 NA | NA |
0.260 NA | NA |
0.000 NA | NA |
0.127 NA | NA |
| 1 spectrum, SGFLLPESR | 0.452 | 0.223 | 0.000 | 0.000 | 0.207 | 0.000 | 0.118 | |||
| 1 spectrum, IATDVLSSR | 0.242 | 0.309 | 0.000 | 0.000 | 0.313 | 0.000 | 0.136 |
| Plot | Lyso | Other | |||||||||||
| Expt C |
3 peptides |
5 spectra |
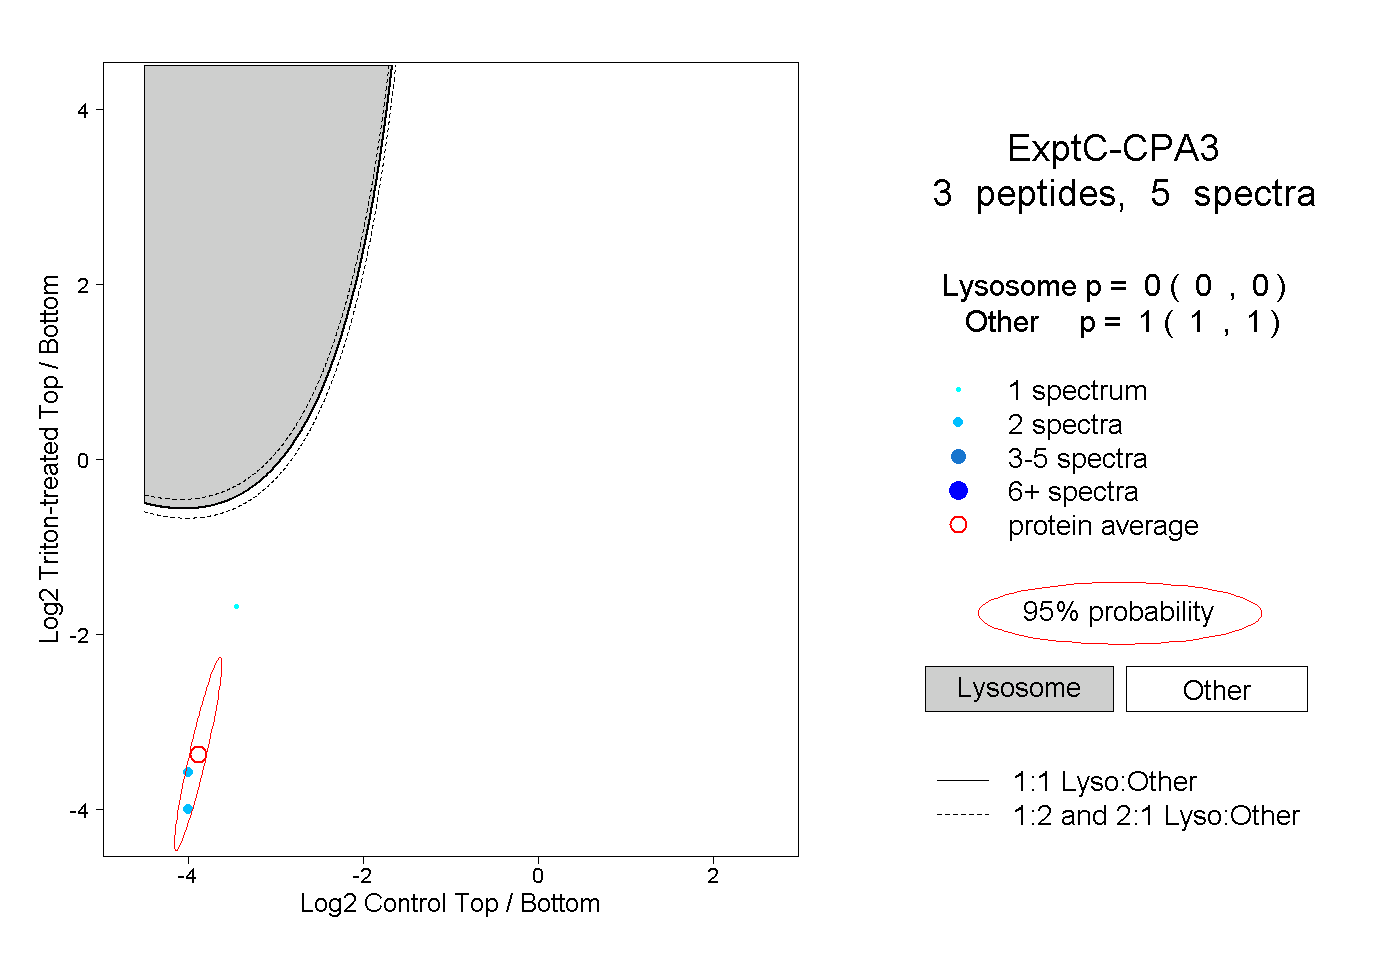 |
0.000 0.000 | 0.000 |
1.000 1.000 | 1.000 |
||||||||
| Plot | Lyso | Other | |||||||||||
| Expt D |
2 peptides |
2 spectra |
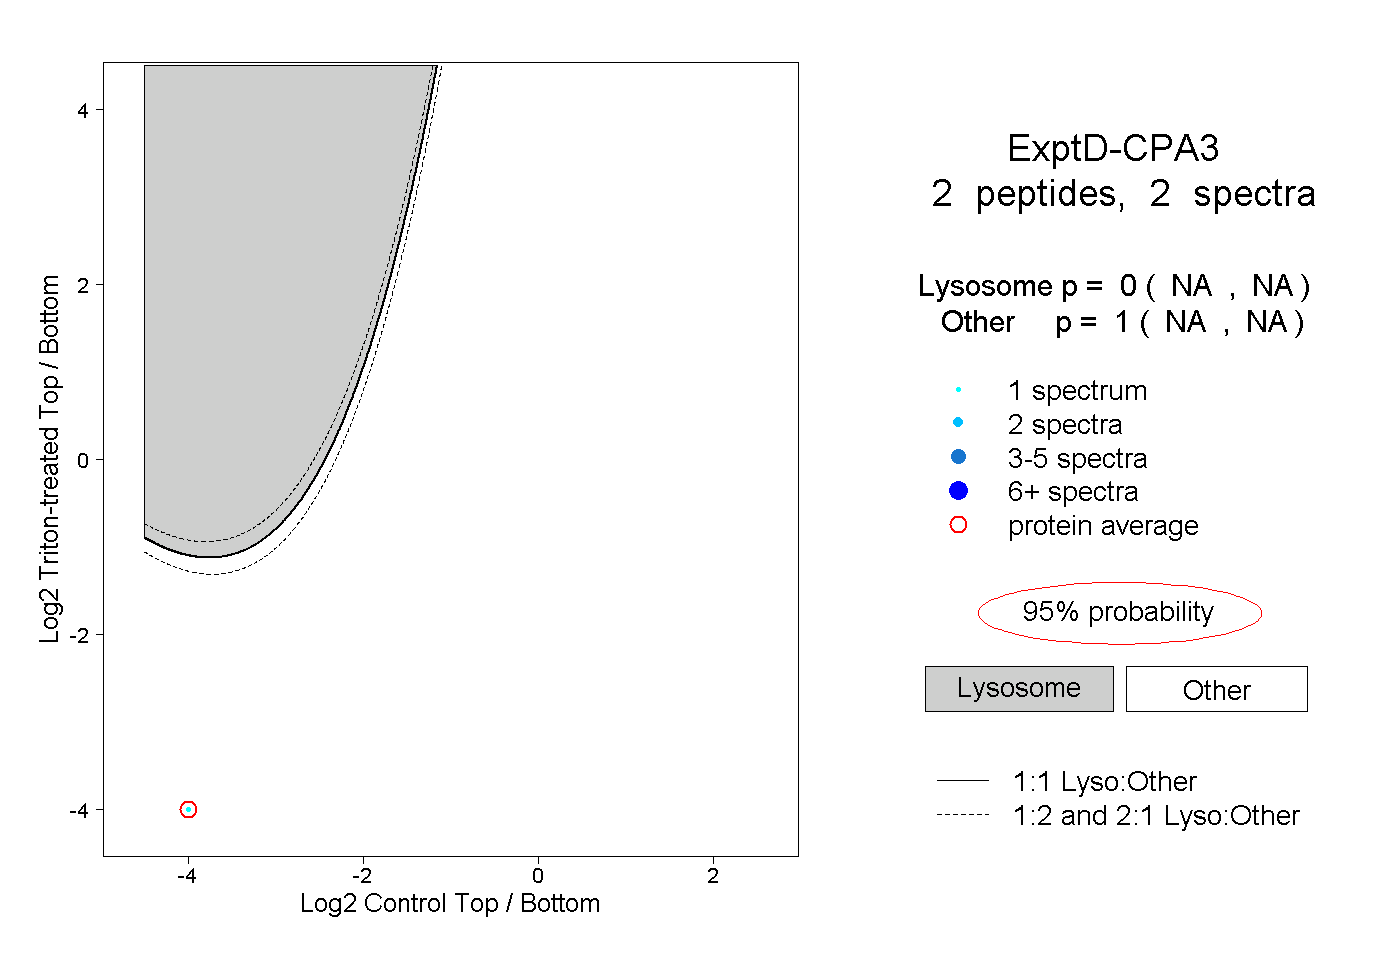 |
0.000 NA | NA |
1.000 NA | NA |