 18
18peptides
spectra
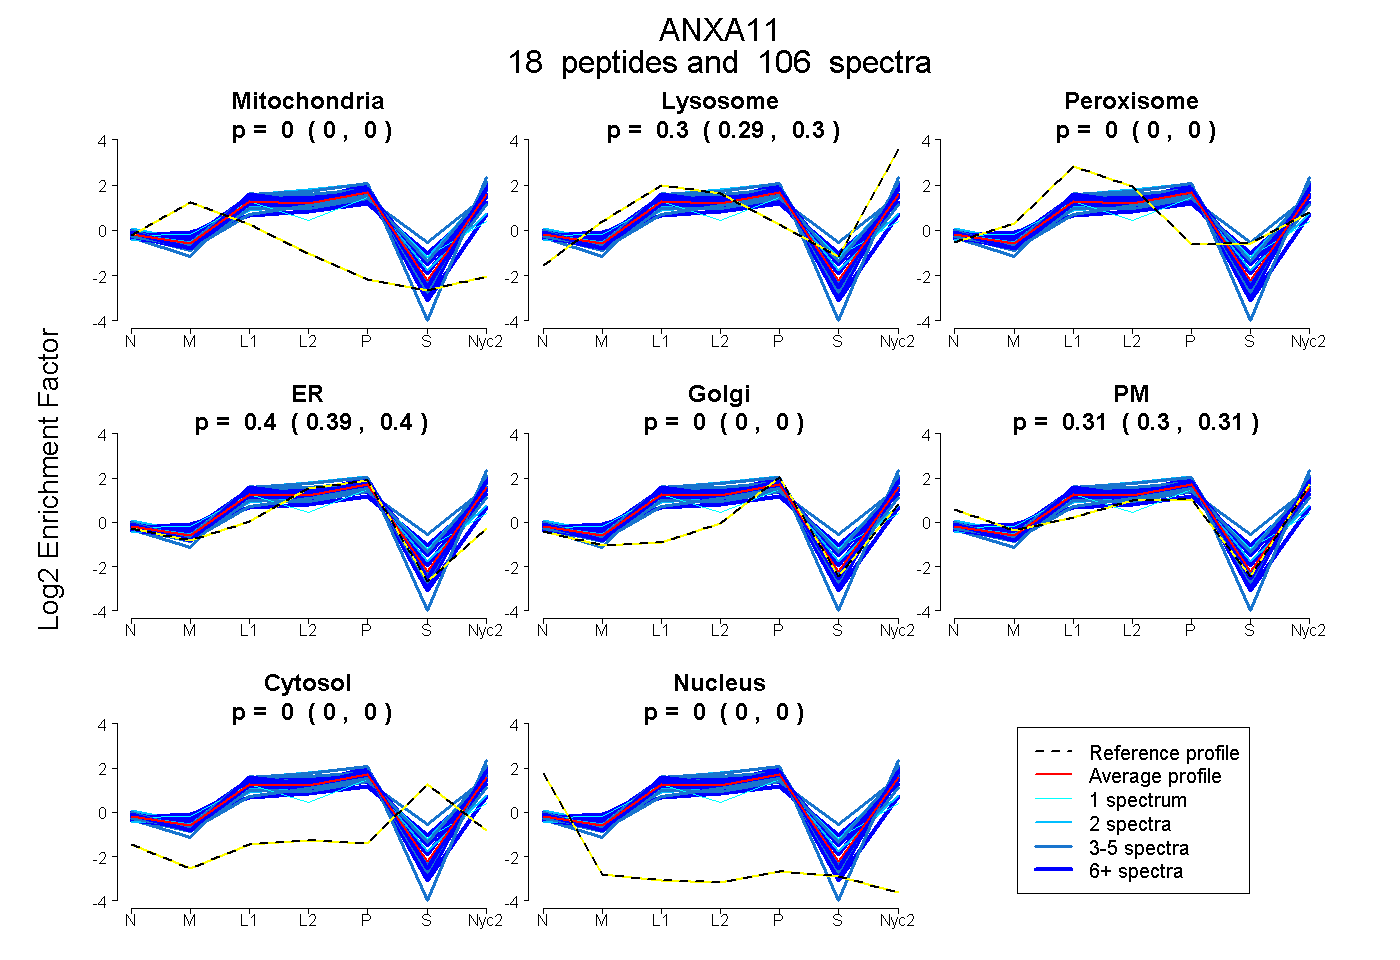
0.000 | 0.000
0.291 | 0.300
0.000 | 0.000
0.390 | 0.404
0.000 | 0.000
0.298 | 0.314
0.000 | 0.000
0.000 | 0.000
16peptides
spectra
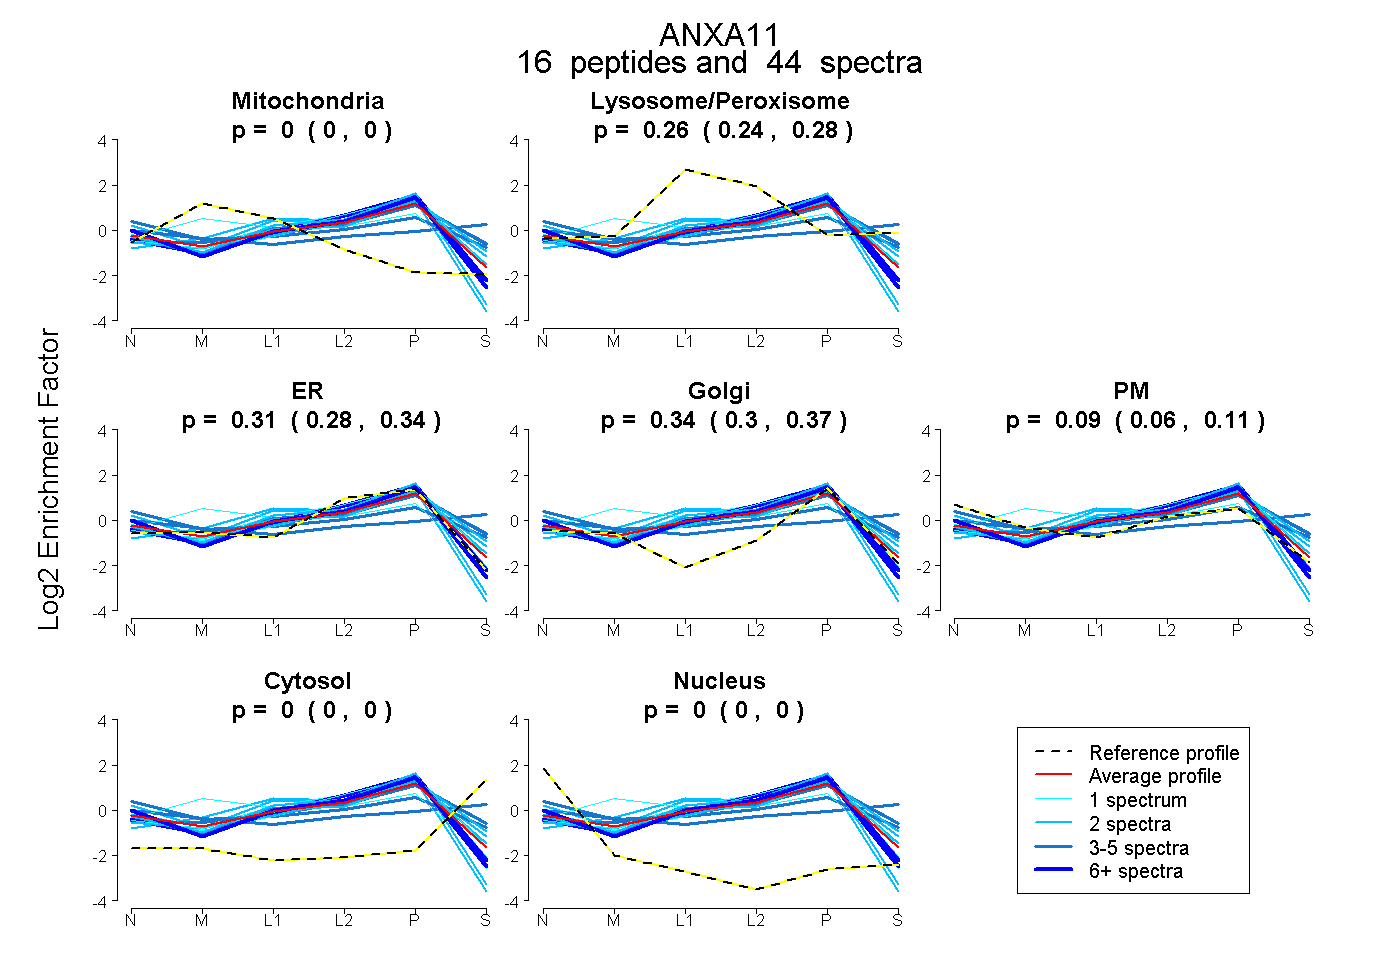
0.000 | 0.000
0.242 | 0.279
0.276 | 0.343
0.303 | 0.367
0.061 | 0.109
0.000 | 0.000
0.000 | 0.000
18peptides
spectra
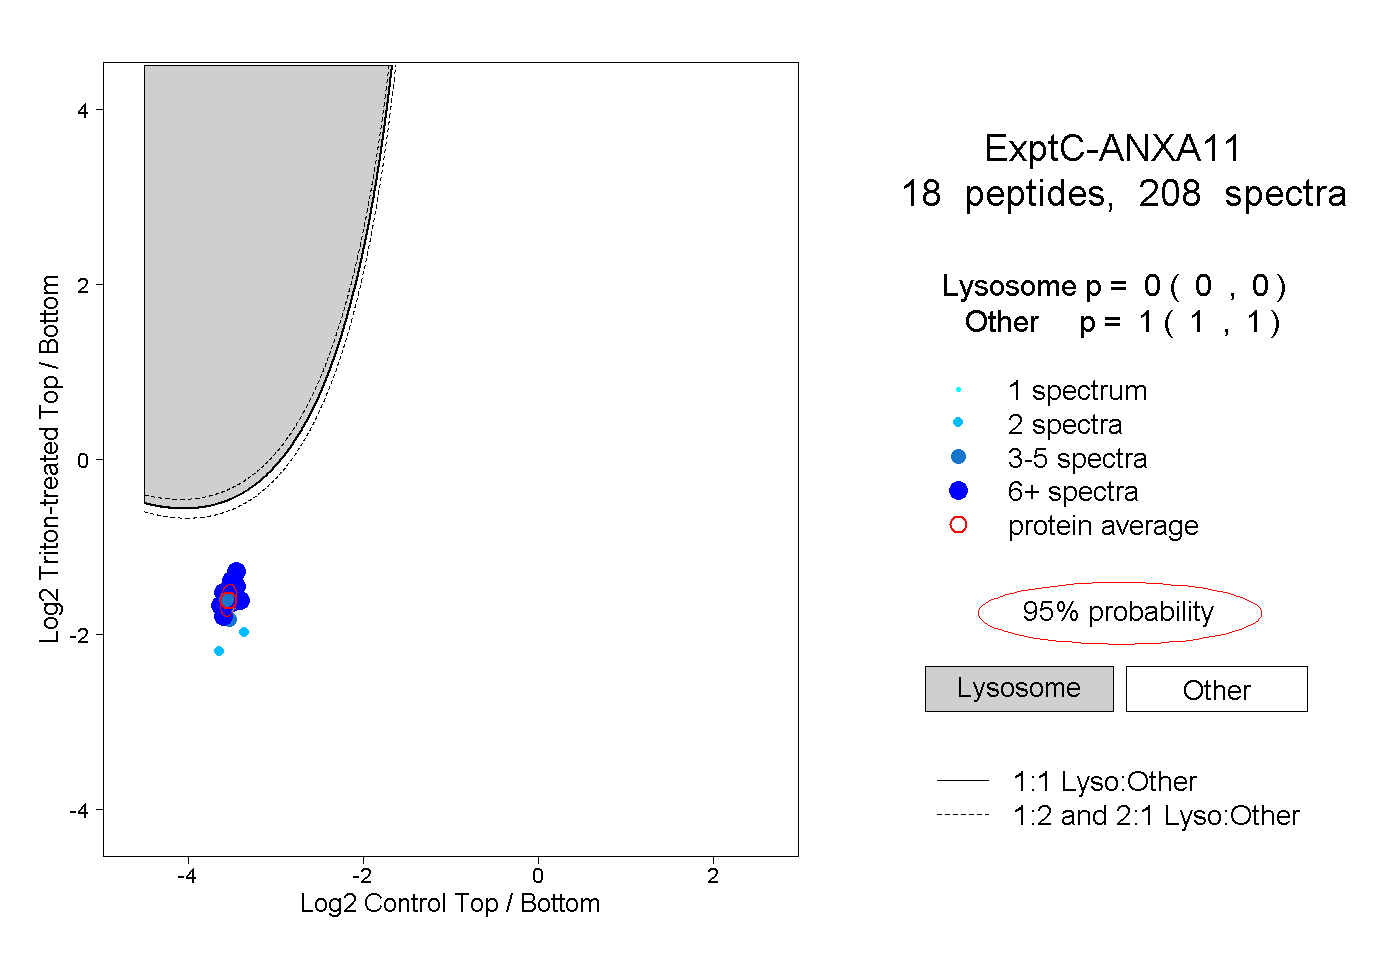
0.000 | 0.000
1.000 | 1.000
8peptides
spectra
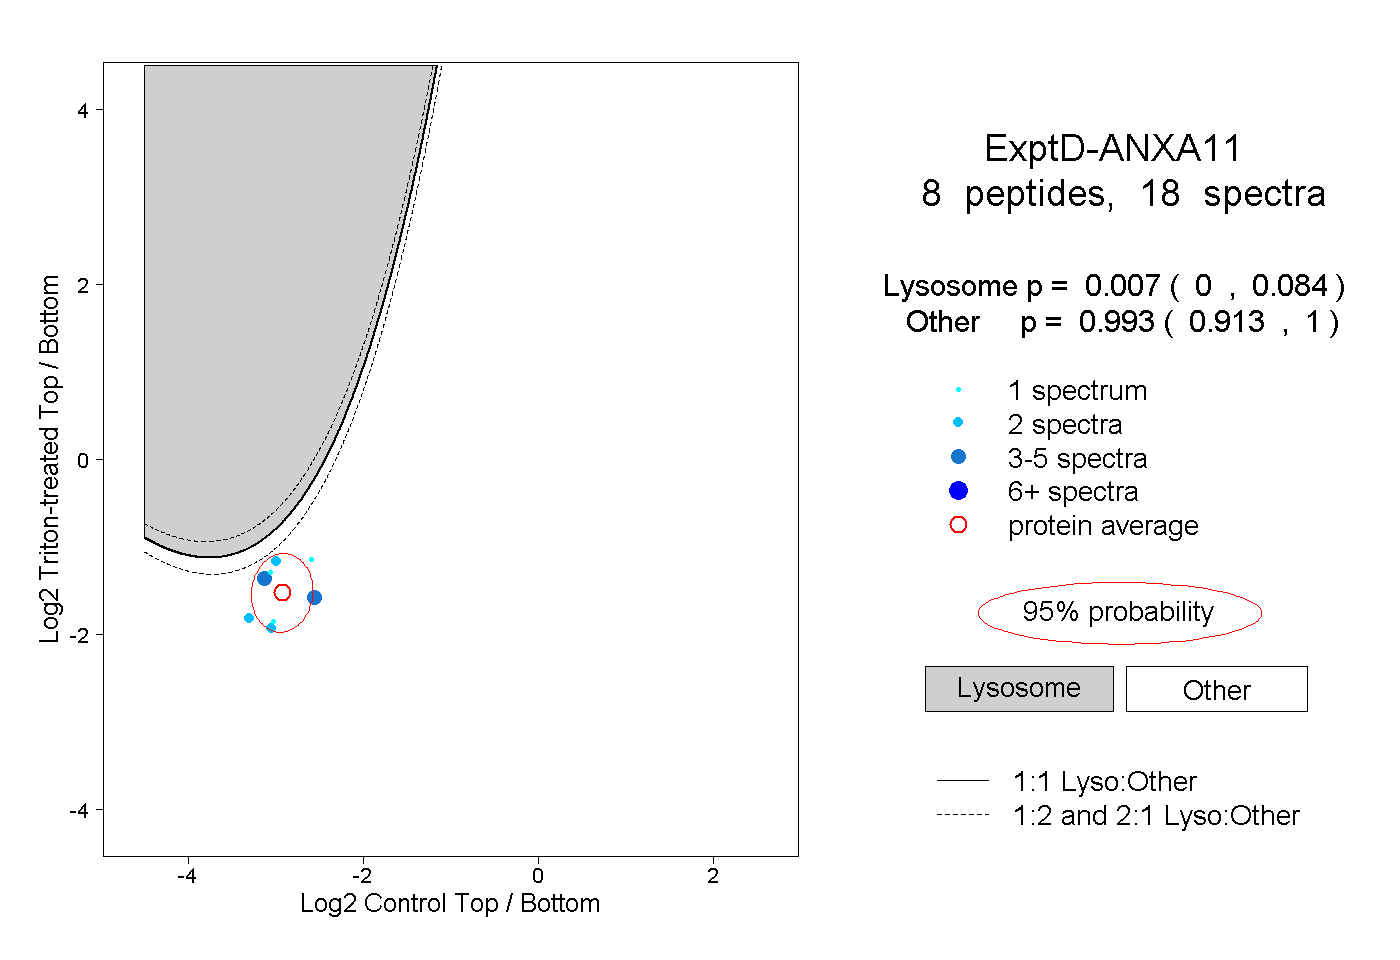
0.000 | 0.084
0.913 | 1.000