 8
8peptides
spectra
0.762 | 0.842
0.057 | 0.164
0.000 | 0.035
0.000 | 0.000
0.000 | 0.000
0.000 | 0.034
0.015 | 0.077
0.000 | 0.037
| Plot | Mito | Lyso | Perox | ER | Golgi | PM | Cytosol | Nucleus | |||||
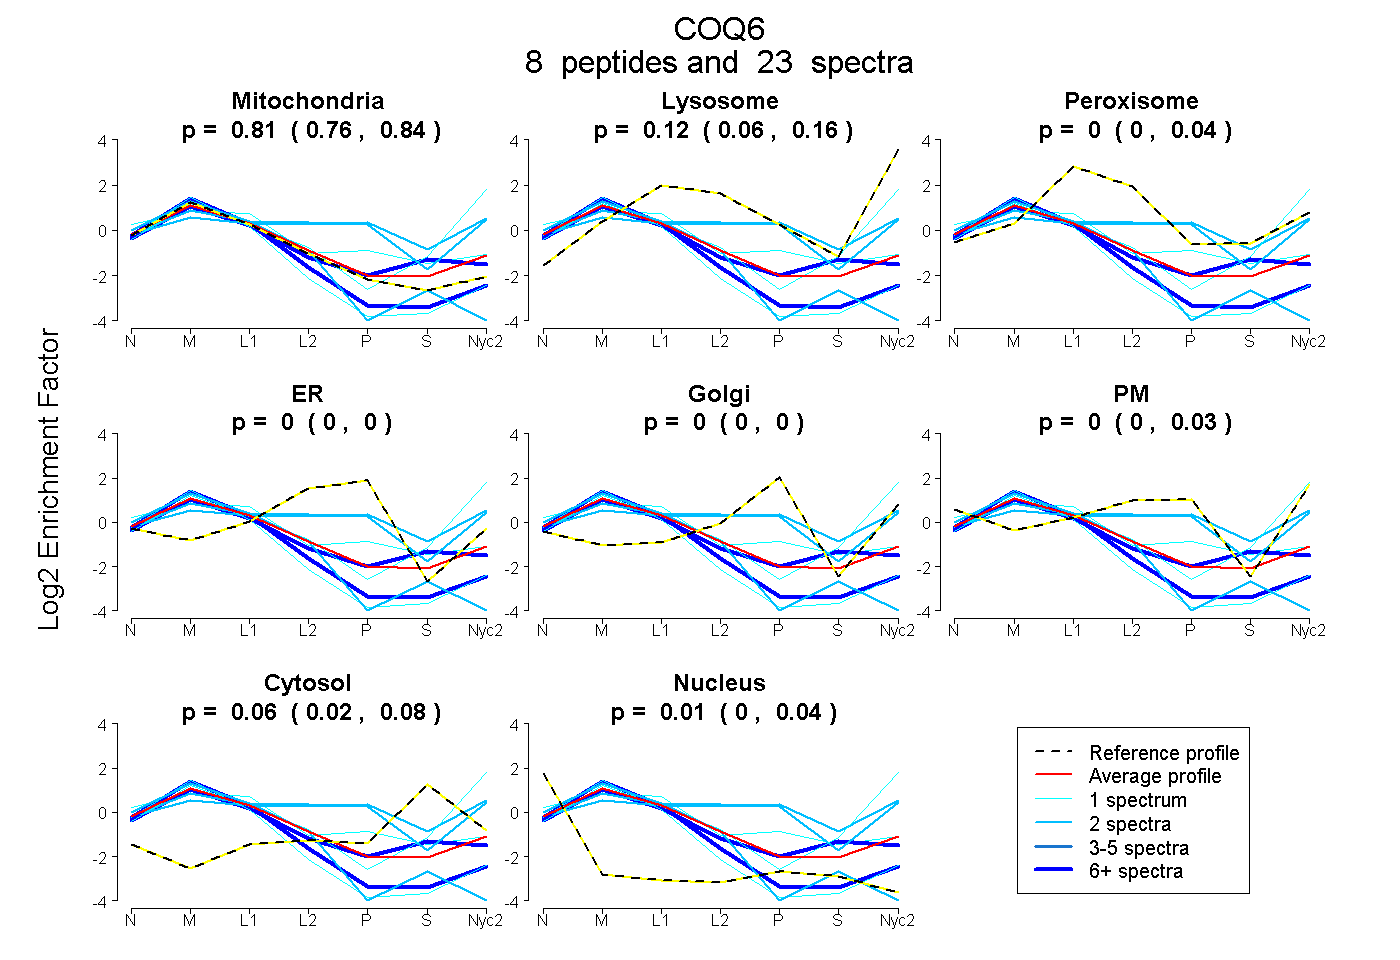
| Expt A |
8 peptides |
23 spectra |
|
0.813 0.762 | 0.842 |
0.123 0.057 | 0.164 |
0.000 0.000 | 0.035 |
0.000 0.000 | 0.000 |
0.000 0.000 | 0.000 |
0.000 0.000 | 0.034 |
0.056 0.015 | 0.077 |
0.008 0.000 | 0.037 |
| 2 spectra, VALIGDAAHR | 0.910 | 0.000 | 0.000 | 0.000 | 0.000 | 0.000 | 0.000 | 0.090 | ||
| 2 spectra, LLIGADGHNSGVR | 0.320 | 0.154 | 0.105 | 0.000 | 0.195 | 0.226 | 0.000 | 0.000 | ||
| 1 spectrum, DLGSMSHLTGYETDR | 0.617 | 0.000 | 0.166 | 0.000 | 0.098 | 0.041 | 0.079 | 0.000 | ||
| 7 spectra, LYSTSTTPLVLLR | 0.951 | 0.000 | 0.000 | 0.000 | 0.000 | 0.000 | 0.000 | 0.049 | ||
| 7 spectra, EQIMAFASR | 0.755 | 0.000 | 0.069 | 0.000 | 0.000 | 0.000 | 0.176 | 0.000 | ||
| 1 spectrum, TWGLQATNAVSPLK | 0.906 | 0.000 | 0.000 | 0.000 | 0.000 | 0.000 | 0.000 | 0.094 | ||
| 1 spectrum, QLEAVADR | 0.458 | 0.431 | 0.000 | 0.000 | 0.000 | 0.000 | 0.099 | 0.011 | ||
| 2 spectra, HNTALLAATDLLK | 0.178 | 0.103 | 0.226 | 0.000 | 0.226 | 0.158 | 0.109 | 0.000 |
| Plot | Mito | Lyso or Perox | ER | Golgi | PM | Cytosol | Nucleus | ||||||
| Expt B |
3 peptides |
10 spectra |
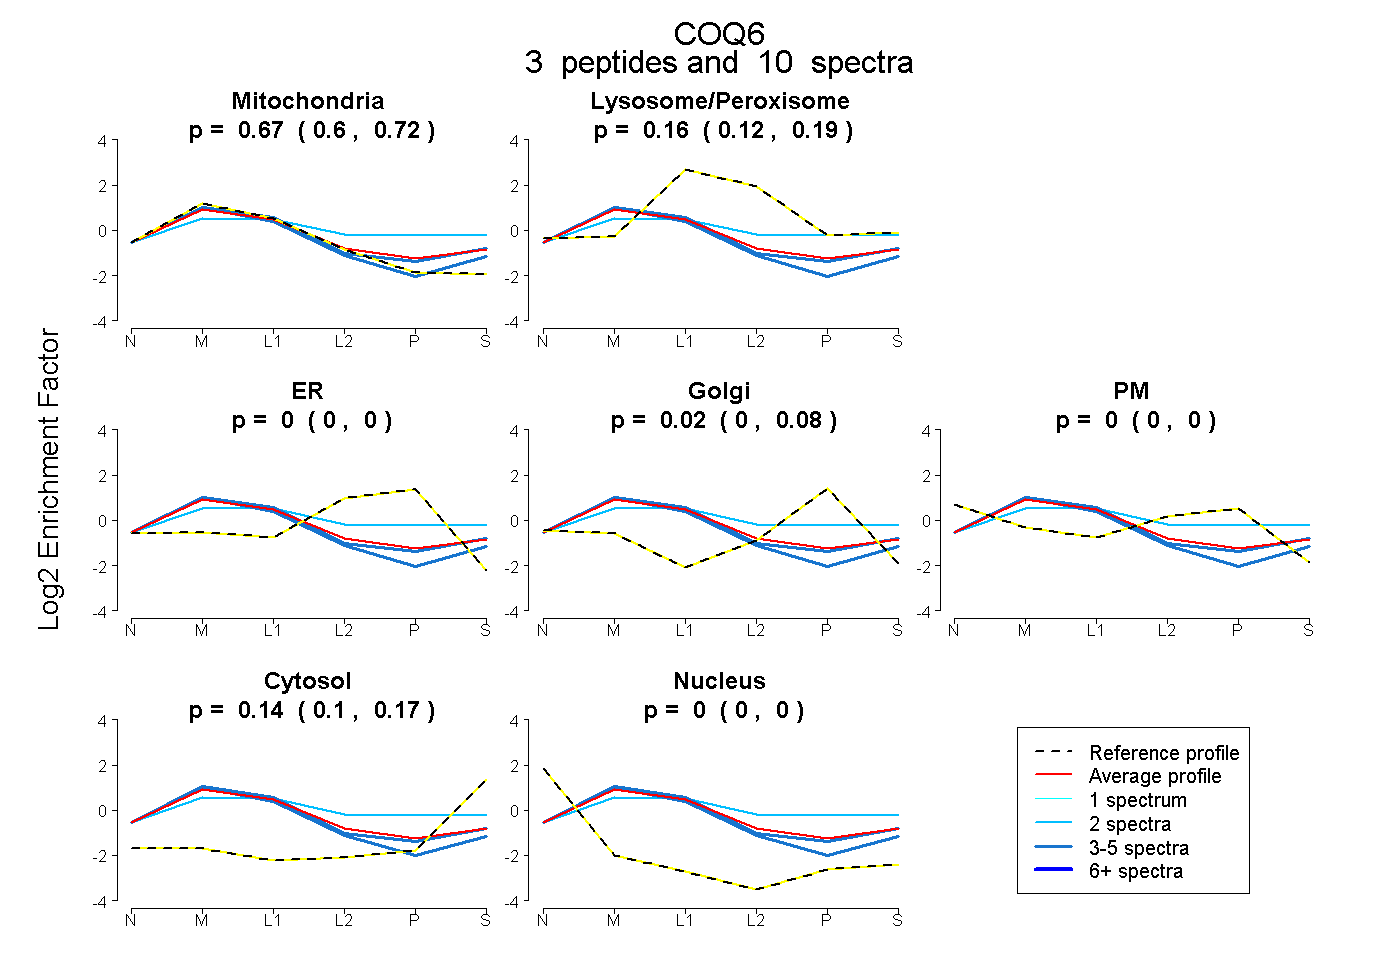 |
0.672 0.599 | 0.720 |
0.162 0.122 | 0.193 |
0.000 0.000 | 0.000 |
0.024 0.000 | 0.081 |
0.000 0.000 | 0.000 |
0.142 0.099 | 0.171 |
0.000 0.000 | 0.000 |
|||
| Plot | Lyso | Other | |||||||||||
| Expt C |
12 peptides |
93 spectra |
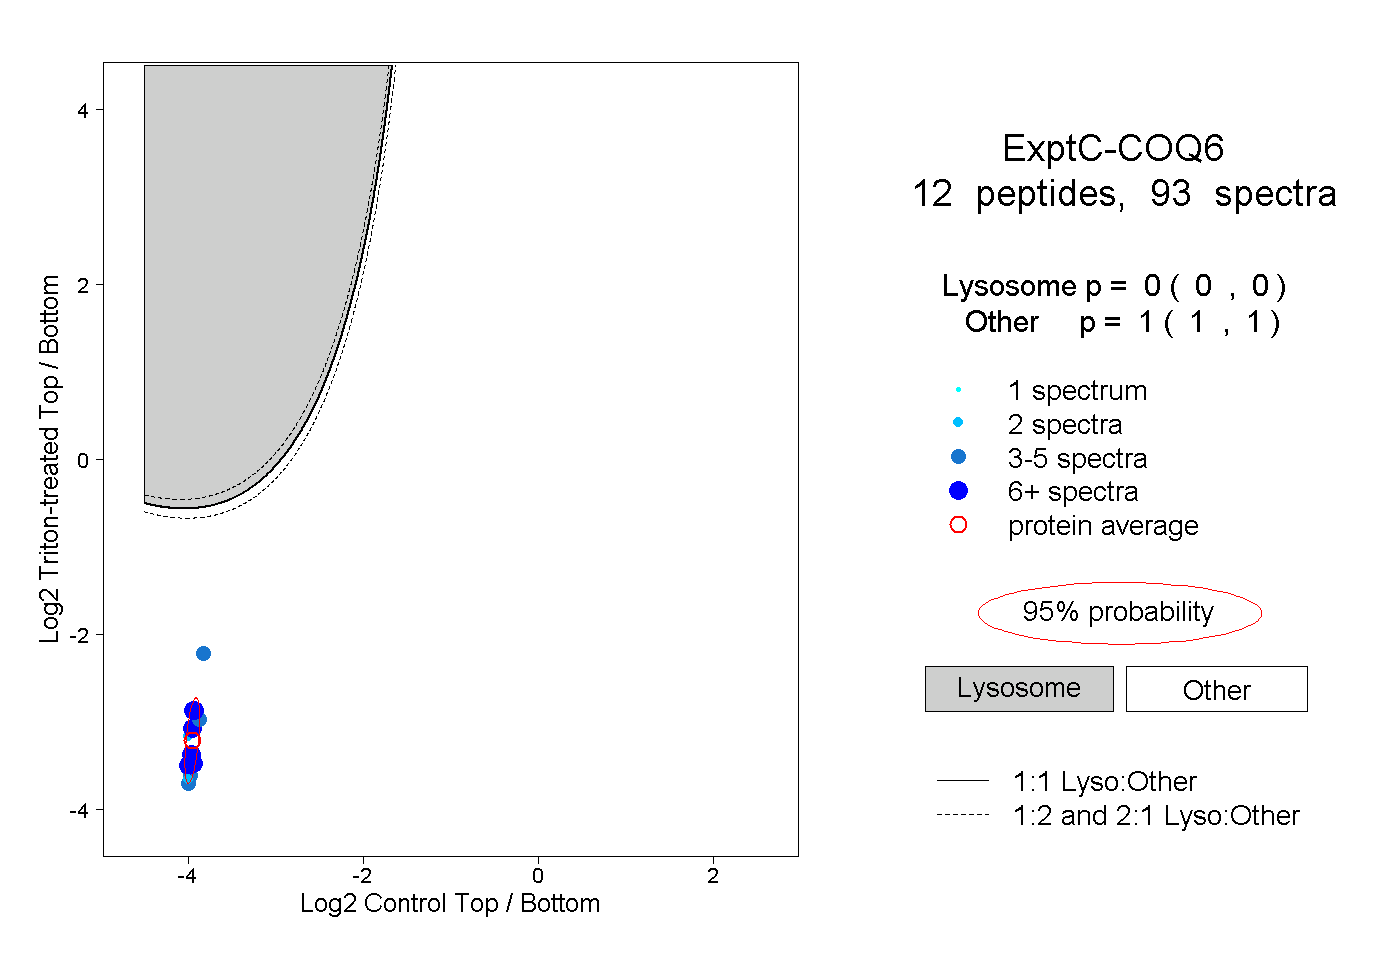 |
0.000 0.000 | 0.000 |
1.000 1.000 | 1.000 |
||||||||
| Plot | Lyso | Other | |||||||||||
| Expt D |
1 peptide |
1 spectrum |
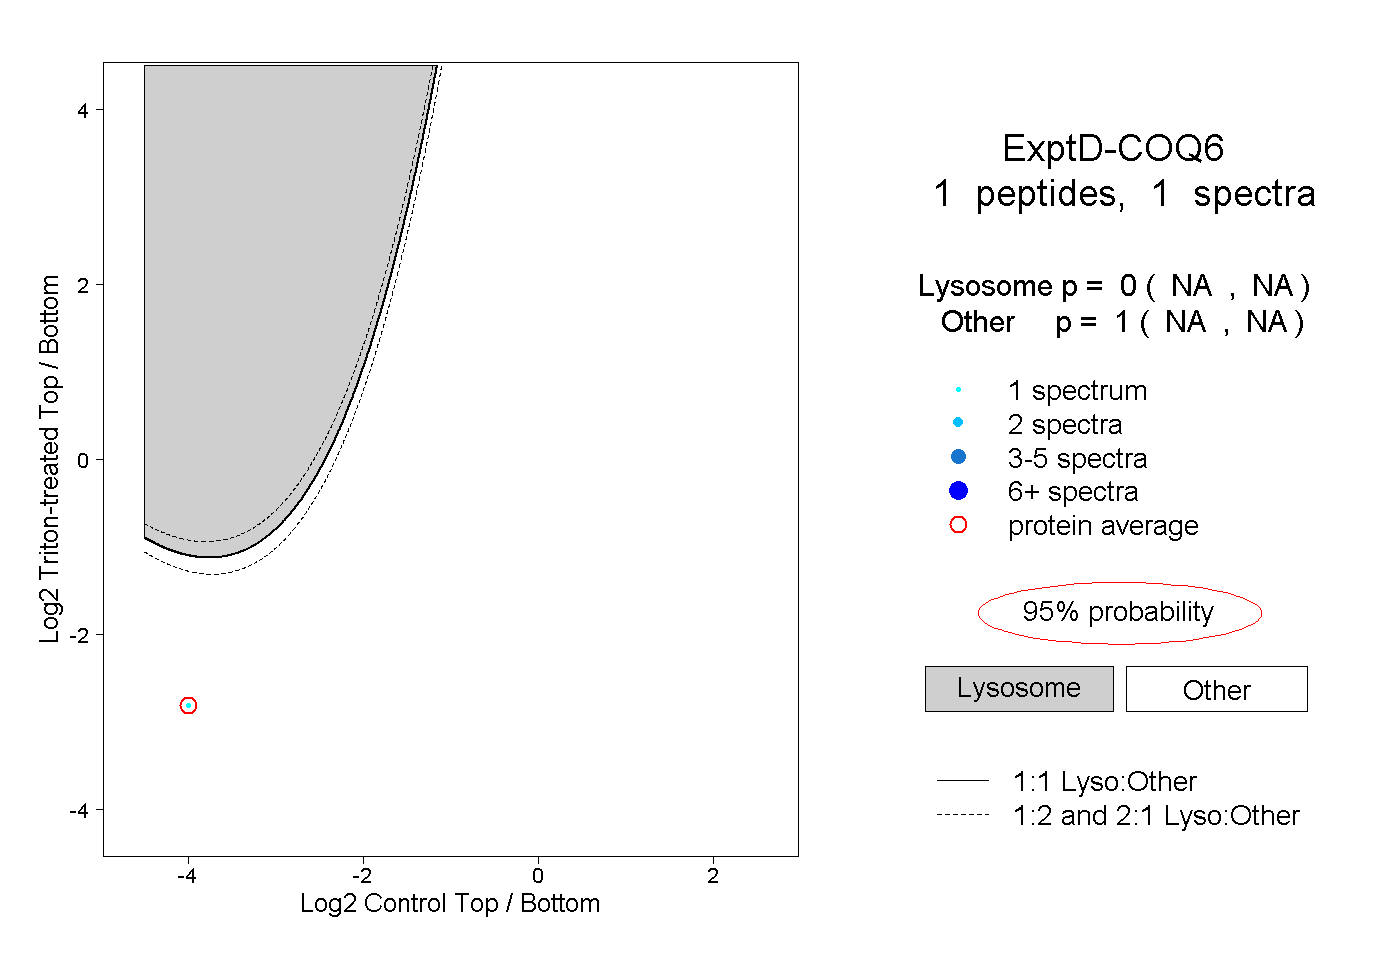 |
0.000 NA | NA |
1.000 NA | NA |