 1
1peptide
spectra

0.000 | 0.000
0.084 | 0.112
0.000 | 0.000
0.000 | 0.000
0.025 | 0.066
0.698 | 0.749
0.111 | 0.139
0.000 | 0.000
1peptide
spectra
0.000 | 0.000
1.000 | 1.000
| Plot | Mito | Lyso | Perox | ER | Golgi | PM | Cytosol | Nucleus | |||||
| Expt A |
1 peptide |
4 spectra |
|
0.000 0.000 | 0.000 |
0.099 0.084 | 0.112 |
0.000 0.000 | 0.000 |
0.000 0.000 | 0.000 |
0.048 0.025 | 0.066 |
0.727 0.698 | 0.749 |
0.126 0.111 | 0.139 |
0.000 0.000 | 0.000 |
||
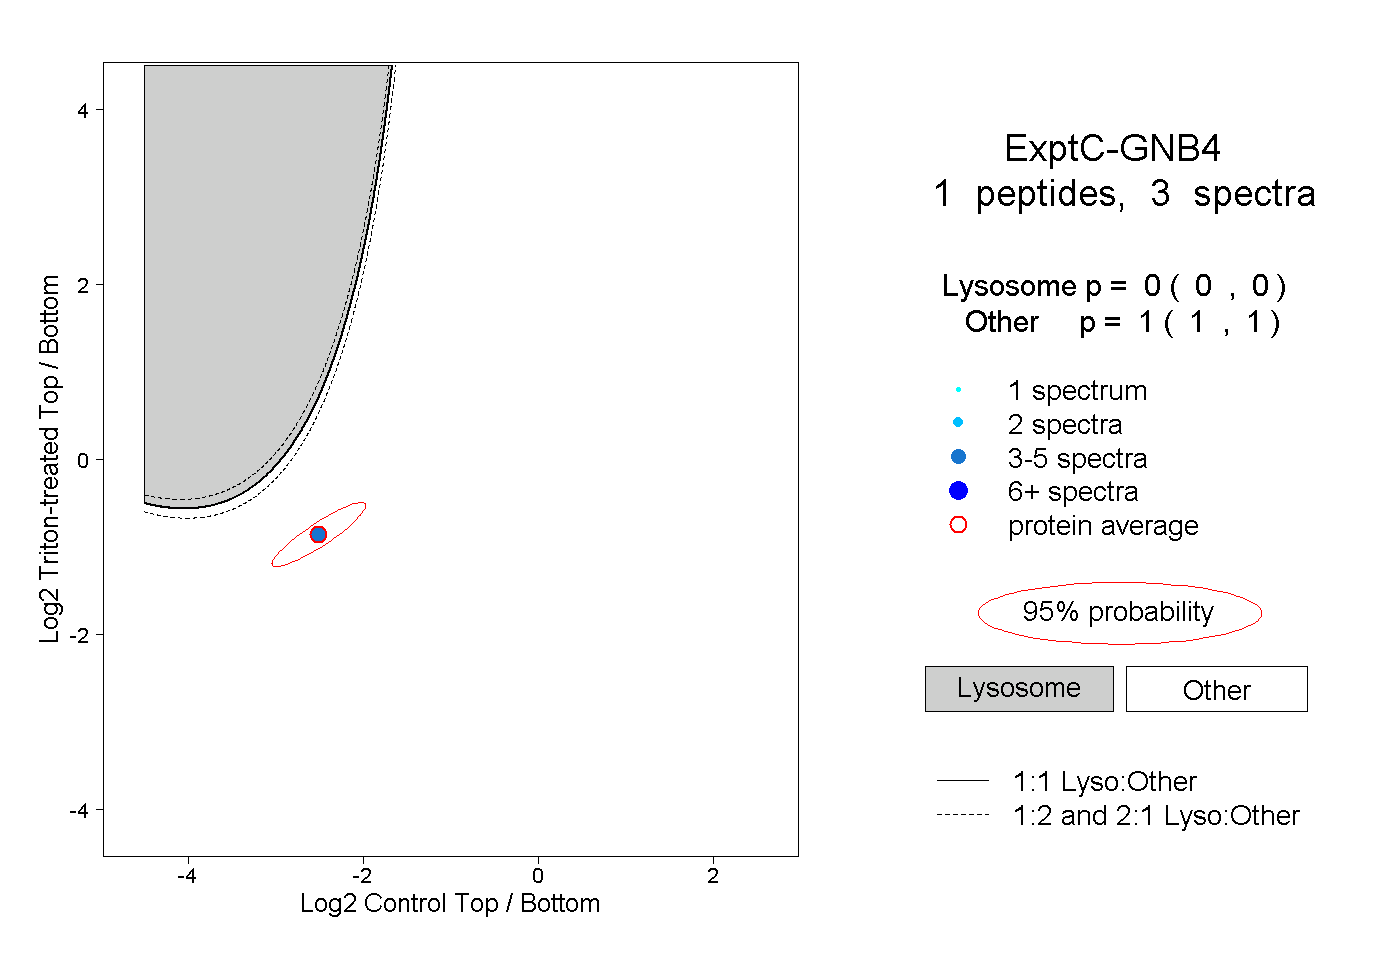
| Plot | Lyso | Other | |||||||||||
| Expt C |
1 peptide |
3 spectra |
|
0.000 0.000 | 0.000 |
1.000 1.000 | 1.000 |